
Figures & data
Table 1 Distribution of the demographic and clinical characteristics of the patients included in the study by groups and statistical analysis of the differences between the two groups
Figure 1 Transtrochanteric approach surgical technique.
Note: Accessing the femoral neck from the fracture line on the proximal femur indicated by dots.
Abbreviations: F, femur; FL, fracture line; GM, gluteus medius; GT, greater trochanter.
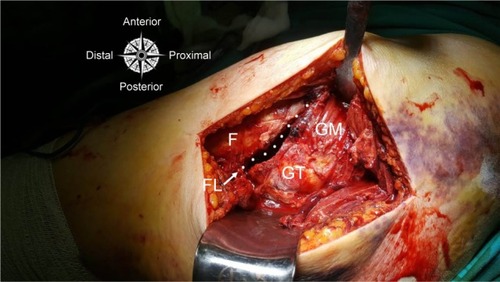
Figure 2 Transtrochanteric approach surgical technique.
Note: Discarding the proximal part after accessing through the fracture line and reaching the femoral neck.
Abbreviations: F, femur; FN, femoral neck; GT, greater trochanter.
Abbreviations: F, femur; FN, femoral neck; GT, greater trochanter.
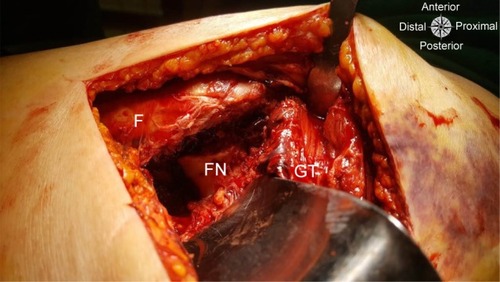
Table 2 Comparison of the two surgical techniques
Table 4 Logistic regression analysis
Table 3 Analysis of other factors that affect the formation of dislocation