
Figures & data
Figure 1 Effects of the enhancement and inhibition of autophagy upon renal function.
Abbreviations: 3-MA, 3-methyladenine; BUN, blood urea nitrogen; HE, hematoxylin-eosin; I/R, ischemia-reperfusion; Rap, rapamycin; SCr, serum creatinine.
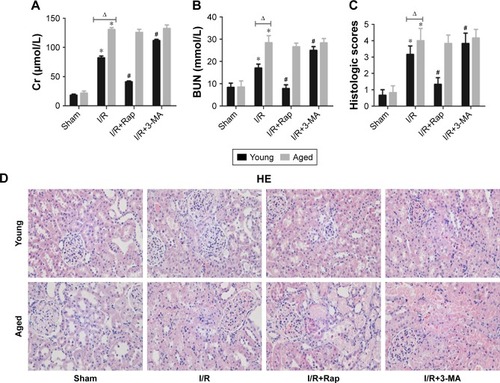
Figure 2 Immunoblotting of LC3-II (A) (original magnification ×400). IOD/area indicating the expression of LC3-II (B). Both in young and aged groups, compared with I/R group, the IOD/area of LC3-II was higher when pretreated with rapamycin; the IOD/area of LC3-II was lower when pretreated with 3-MA. Data are shown as the mean ± SD (n=6). *P<0.05 vs same age sham-operated group; #P<0.05 vs same age I/R group; ΔP<0.05 vs young group under the same interventions.
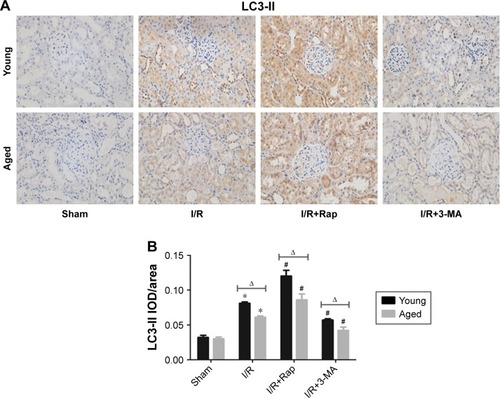
Figure 3 Expressions of autophagy-related proteins in young and aged rats, including LC3-II/LC3-I, Beclin-1 and P62 (A–C). Representative blots showing the effects of the enhancement and inhibition of autophagy upon active LC3-II/LC3-I, Beclin-1 and P62 expressions in the cytoplasm. The relative band densities of the three types of protein to the mean value of the control group in young and aged rats (D–F). Data are shown as mean ± SD (n=6). *P<0.05 vs same age sham-operated group; #P<0.05 vs the same age I/R group; ΔP<0.05 vs young group under the same interventions.
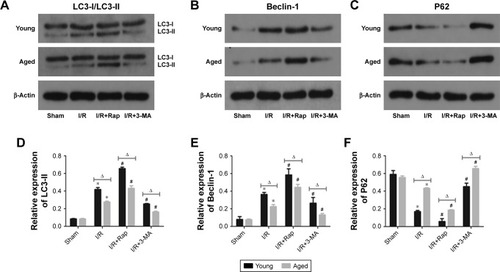
Figure 4 High magnification electron micrographs showing ultrastructure changes (A) (sham, I/R, I/R+Rap, and I/R+3-MA groups, original magnification ×1,700; I/R+3-MA groups, original magnification ×5,000). Autophagic vacuoles (white arrow) containing whorls of membranous material and some cytoplasm. In the young and aged groups, the most numerous double-membrane autophagic vacuoles were found in the I/R+Rap group, flowed by the I/R group; the least number of vacuoles was found in the sham group. Quantification of the number of autophagic vacuoles per 100 µm2 cytoplasm (B).
Abbreviations: 3-MA, 3-methyladenine; I/R, ischemia-reperfusion; Rap, rapamycin.
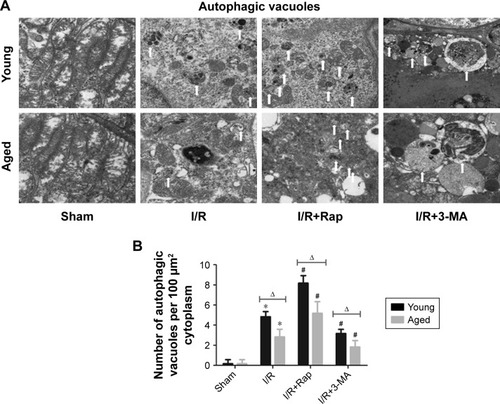
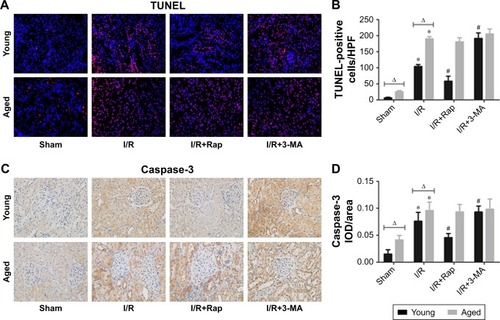
Figure 5 Immunofluorescent image of TUNEL staining for apoptotic cells in kidney tissue (A) (original magnification ×400) and immunoblotting of caspase-3 (B) (original magnification ×400). Nuclei of TUNEL-positive cells are stained red. Mean number of TUNEL-positive cells per high power field (HPF ×400) (C). IOD/area indicated the expression of caspase-3 (D). Data are shown as mean ± SD (n=6). *P<0.05 vs the same age sham-operated group; #P<0.05 vs same age I/R group; ΔP<0.05 vs young group under the same interventions.
Data availability
The data used to support the findings of this study are available from the corresponding authors upon request.