Figures & data
Table 1 Patient demographics at baseline
Table 2 Summary of the spatiotemporal and stability parameters, trunk motion, and stance phase knee flexion at baseline (mean + SD)
Figure 1 Trunk motion over time. Higher values indicate more anterior position of the trunk in comparison to the pelvis.
Notes: (A) Trunk motion at baseline. Significantly more flexed posture without orthosis (P<0.05). (B) Trunk motion after 6 weeks wearing the orthosis showed no difference between walking with and without orthosis. (C) Trunk motion after 6 months, showing a pattern comparable to that found at baseline (P<0.05).
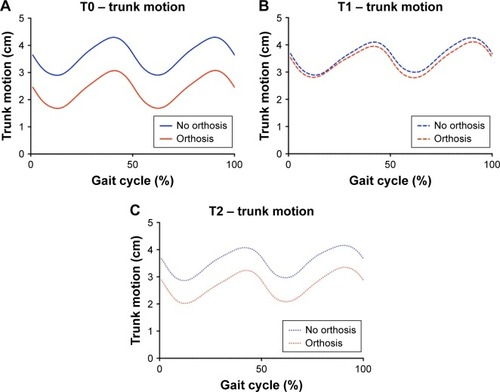
Table 3 Spatiotemporal and stability parameters, trunk motion, and stance phase knee flexion at the different time points (means ± SD)
Figure 2 Radiographic sagittal balance. Graphs represent mean ± SD at each time point.
Notes: (A) GSA, significant improvement T0 versus T1 (P<0.001), relapse at T2. (B) GAP score, significant improvement T0 versus T1 (P=0.001), relapse at T2. (C) SVA, improvement T0 versus T1 (P=0.089), relapse at T2. (D) Wedge angle, significant increase at 6 weeks (*P<0.001) and 6 months (**P<0.001).
Abbreviations: GSA, global sagittal alignment; GAP, global alignment and proportion; SVA, sagittal vertical axis.
Abbreviations: GSA, global sagittal alignment; GAP, global alignment and proportion; SVA, sagittal vertical axis.
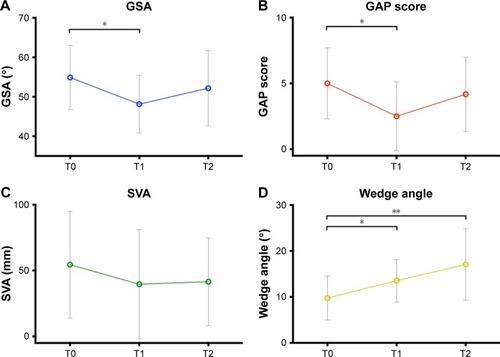
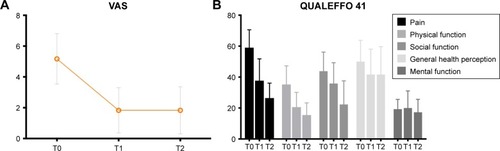
Figure 3 Pain and quality of life. Graphs represent mean ± SD.
Notes: (A) Statistically significant improvement in VAS score over time (T0 vs T1 P<0.001, T0 vs T2 P<0.001). (B) QUALEFFO 41 results. Statistically significant improvement over time in the QUALEFFO pain domain (T0 vs T1 P<0.001, T0 vs T2 P<0.001), physical function (T0 vs T1 P=0.001, T0 vs T2 P<0.001), and social function (T0 vs T1 P=0.091, T0 vs T2 P<0.001).
Abbreviations: VAS, visual analogue scale; QUALEFFO, Quality of Life Questionnaire of the European Foundation for Osteoporosis.
Abbreviations: VAS, visual analogue scale; QUALEFFO, Quality of Life Questionnaire of the European Foundation for Osteoporosis.