
Figures & data
Figure 1 Recruitment process for the study group.
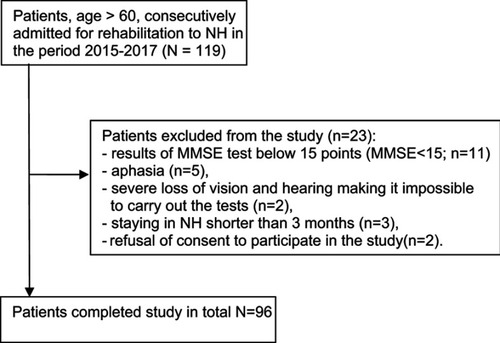
Table 1 The characteristics of the patients (N=96)
Table 2 The level of illness acceptance by patients at the initial and final assessments (Mann–Whitney test and Kruskal–Wallis test)
Table 3 Mean values for the tested parameters in the initial and final assessments
Table 4 Comparison of selected factors between patients with a low or high level of illness acceptance after 3 months of rehabilitation
Table 5 Comparison between patients with a low or high level of illness acceptance after 3 months of rehabilitation
Table 6 Results of the Spearman’s rank correlation for selected pairs of variables in the studied group