Figures & data
Figure 1 The flow diagram of enrollment.
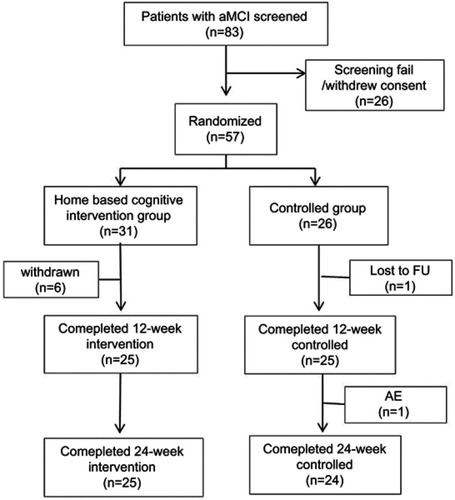
Table 1 Baseline characteristics and demographics of subjects
Table 2 Changes in efficacy outcomes at 12 and 24 weeks
Figure 2 Changes from baseline at 12 weeks and 24 weeks on efficacy outcomes. Cognitive training significantly improved ADAS-Cog score at 24 weeks (A), COWAT total score at 12 and 24 weeks (B) and GDS-15 at 12 and 24 weeks (C). (A) Changes from baseline at 12 weeks and 24 weeks on the Modified ADAS-Cog. (B) COWAT (total) score change from baseline on Intervention group vs Control (C) GDS-15 (SGDS-K) score change from baseline on Intervention group vs Control.
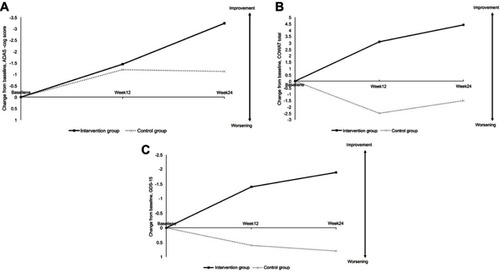
Table 3 The basic demographic features of participants who performed PET CT comparing all participants
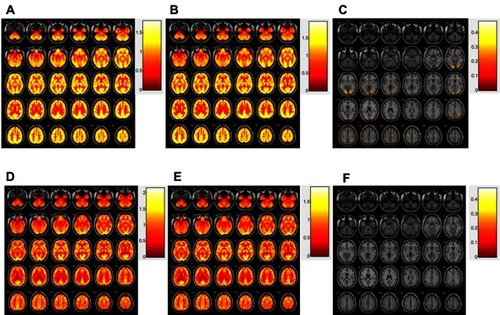
Figure 3 Distribution of SUVr before treatment (A), after treatment (B), and more than 20% increased region after treatment (C) in participant with change (-). Distribution of SUVr before treatment (D), after treatment (E), and no increased region after treatment (F) in participant without change (Fig 3-2).