
Figures & data
Table 1 Characteristics of patients, number of medications, and DRPs
Figure 1 PCNE categories of possible drug-related problems and their frequencies.
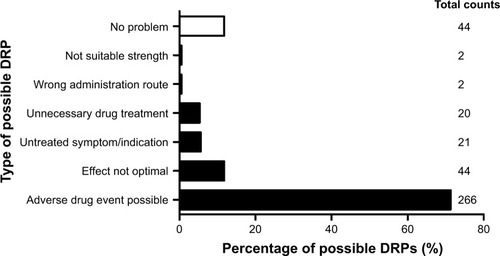
Table 2 PCNE categories of most encountered causes of possible DRPs and their frequencies
Figure 2 PCNE categories of interventions proposed by the pharmacist and their acceptance rates.
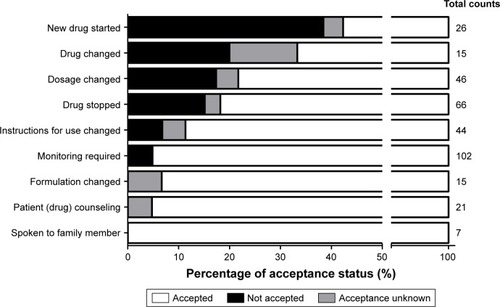
Table 3 Total number of ordered medications, most frequently ordered medications, and medications with the highest number of possible DRPs in each ATC class
Figure 3 Most frequently ordered medications and possible interaction or incompatibility risk in function of their prescription frequency. (Numbers above each bar represent total counts.)
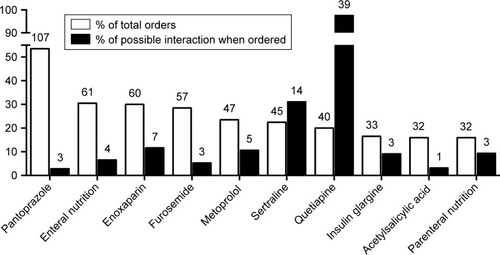
Table S1 Types and causes of problems, proposed interventions, and acceptance status for proposed interventions