Figures & data
Table 1 Anthropometric parameters of the examined groups (mean ± SD)
Table 2 Selected parameters of pro- and antioxidant balance in the blood of the examined groups (mean ± SD)
Figure 1 Maloddialdehyde (MDA) concentration with the trend line showing the tendency of change with age.
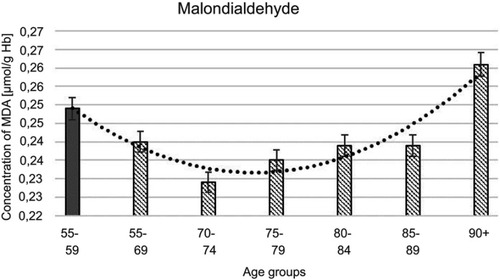
Figure 2 Superoxide dismutase (SOD) activity with the trend line showing the tendency of change with age.
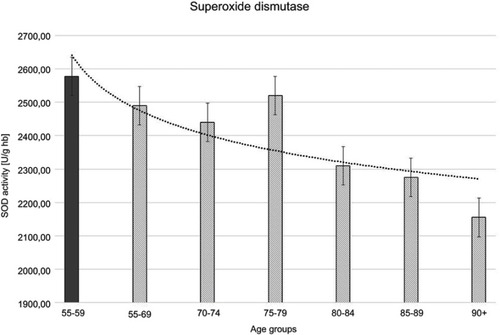
Figure 3 Catalase (CAT) activity with the trend line showing the tendency of change with age.
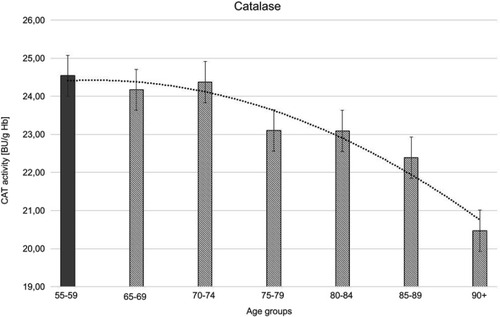
Figure 4 Glutathione peroxidase (GSH-Px) activity with the trend line showing the tendency of change with age.
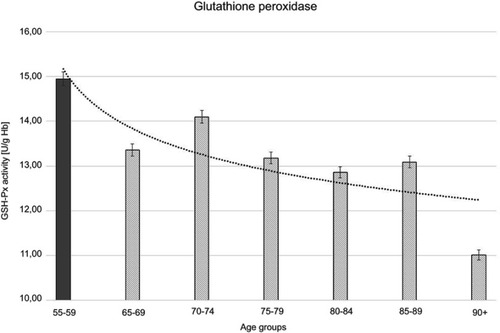
Figure 5 Glutathione reductase (GR) activity with the trend line showing the tendency of change with age.
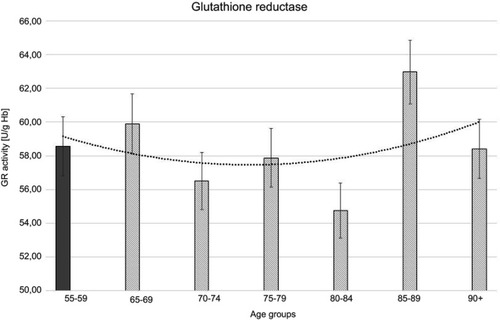
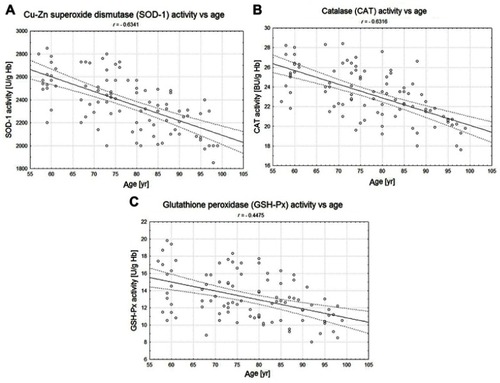
Figure 6 The correlations between the erythrocytic Zn-Cu superoxide dismutase (SOD-1) (A), catalase (CAT) (B), and glutathione peroxidase (GSH-Px) (C) activities and age of examined persons (P<0.05).