
Figures & data
Figure 1 Typical ultrasound images. Transversal ultrasound images of anterior radial muscle and anterior ulnar muscle (A), posterior tibial muscle and posterior fibula muscle (B). Maximal muscle thickness was measured separately between the upper fascia to radius and ulna leading edge or to tibia and fibula trailing edge at the widest distance. Pennation angles were measured between muscle fiber and the deep fascia of the muscle (C and D).
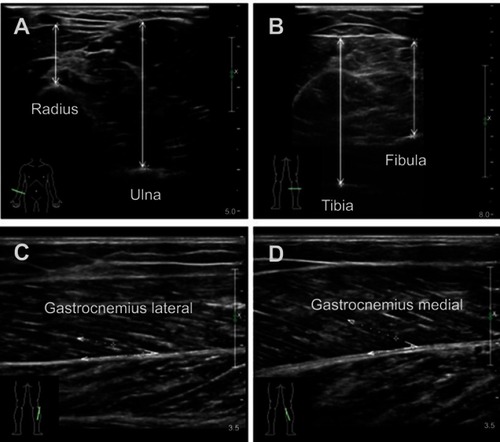
Table 1 Comparison of anthropometrics, MT, PA, muscle mass, grip strength, gait speed and SPPB of the subjects by gender
Table 2 Effects of age on general characteristics, MT, PA, muscle mass, grip strength, gait speed and SPPB
Table 3 Partial correlation between MT, PA and regional LMs, RASM, grip strength, gait speed or SPPB
Table 4 Multiple linear regression analysis of MT and PA on RASM, grip strength, gait speed or SPPB