
Figures & data
Figure 1 Study profile including patients’ selection and mortality information.
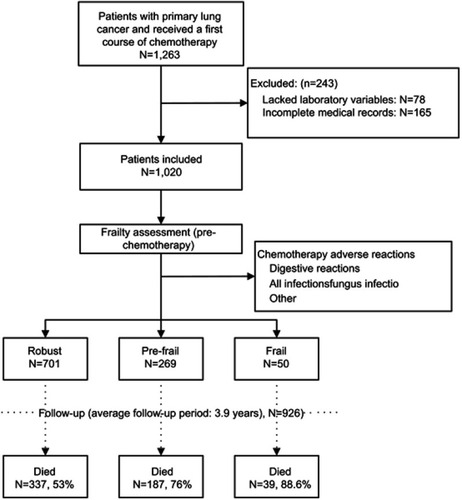
Figure 2 Survival curves 926 patients with primary lung cancer receiving chemotherapy according to baseline frailty status assessed by FI-LAB.
Abbreviation: FI-LAB, frailty index based on laboratory variables.
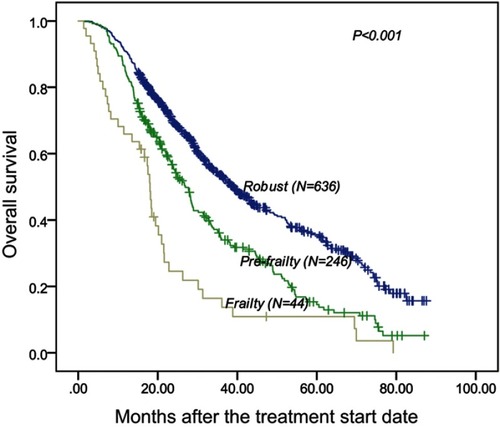
Table 1 Characteristics of the study population according to frailty assessed by FI-LAB
Table 2 The differences of short-term chemotherapy adverse reactions according to baseline frailty status
Table 3 The associations between frailty and risk of short-term chemo adverse reactions
Table 4 The prognostic role of frailty in predicting all-cause mortality
Table S1 Laboratory variables for frailty index