195
Views
17
CrossRef citations to date
0
Altmetric
Original Research

Lumbar spinal stenosis associated with progression of locomotive syndrome and lower extremity muscle weakness

, , , , , , , , & show all
Pages 1399-1405 | Published online: 05 Aug 2019

Figures & data

Table 1 LSS diagnostic support tool

Figure 1 The muscle strength of the lower extremities, including hip flexors (A) and knee extensors (B), was measured with a handheld dynamometer (Commander™ PowerTrack II™ Handheld Dynamometer; Nihon Medix Co., Ltd., Matsudo, Japan). The mean strength of the two lower extremities was calculated and all calculations were performed twice. Isometric back extensor strength in the prone position was measured using a strain-gauge dynamometer (DPU-1000N Digital Force Gauge; Imada, Toyohashi, Japan) (C). The subject was aligned on the board with a strain-gauge dynamometer attached to the subject’s back. After the strain-gauge was placed (at the mid-portion of back at the inferior part of scapula), we asked the subject to lift their upper trunk as high as possible. The strain-gauge recorded the maximum strength. Measurements were performed three times and the values from the trial that produced the greatest force were selected.

Figure 1 The muscle strength of the lower extremities, including hip flexors (A) and knee extensors (B), was measured with a handheld dynamometer (Commander™ PowerTrack II™ Handheld Dynamometer; Nihon Medix Co., Ltd., Matsudo, Japan). The mean strength of the two lower extremities was calculated and all calculations were performed twice. Isometric back extensor strength in the prone position was measured using a strain-gauge dynamometer (DPU-1000N Digital Force Gauge; Imada, Toyohashi, Japan) (C). The subject was aligned on the board with a strain-gauge dynamometer attached to the subject’s back. After the strain-gauge was placed (at the mid-portion of back at the inferior part of scapula), we asked the subject to lift their upper trunk as high as possible. The strain-gauge recorded the maximum strength. Measurements were performed three times and the values from the trial that produced the greatest force were selected.

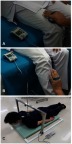
Table 2 Participant characteristics

Table 3 Locomotive syndrome risk test

Table 4 Risk levels for locomotive syndrome from the three tests

Table 5 Muscle strength