104
Views
0
CrossRef citations to date
0
Altmetric
Original Research

Usefulness of patellar cartilage cross-sectional area for knee tibiofemoral osteoarthritis in elderly

, , , , , & show all
Pages 1021-1026 | Published online: 05 Jun 2019

Figures & data

Table 1 Comparison of the characteristics of control and KOA group

Figure 1 Measurement of the patellar cartilage cross-sectional area (PCA) on transverse turbo spin echo fat-suppressed T2-weighted image. (A) Control group. (B) Knee tibiofemoral osteoarthritis group.

Figure 1 Measurement of the patellar cartilage cross-sectional area (PCA) on transverse turbo spin echo fat-suppressed T2-weighted image. (A) Control group. (B) Knee tibiofemoral osteoarthritis group.

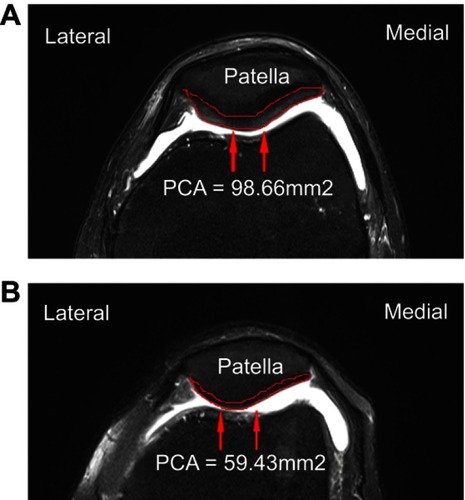
Table 2 Age distribution of patients with mean PCA of control group

Table 3 Age distribution of patients with mean PCA of KOA group

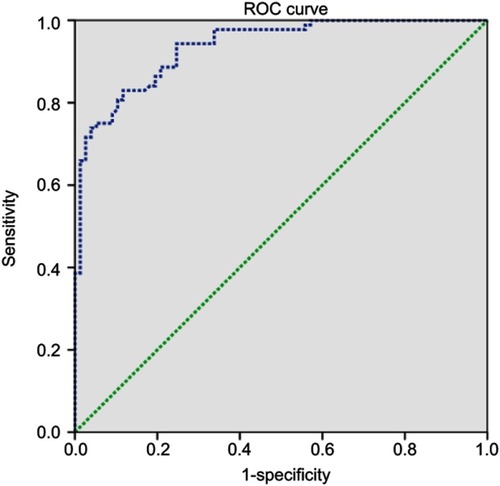
Table 4 Sensitivity and specificity of each cutoff point of the PCA

Figure 2 Receiver operating characteristic (ROC) curve of patellar cartilage cross-sectional area (PCA) for prediction of knee osteoarthritis. The best cutoff point of PCA was 76.06 mm2, with sensitivity of 83.0%, specificity of 83.1% and AUC of 0.94. PCA AUC (95% CI) =0.94 (0.90–0.97).

Abbreviation: AUC, area under the curve.
Figure 2 Receiver operating characteristic (ROC) curve of patellar cartilage cross-sectional area (PCA) for prediction of knee osteoarthritis. The best cutoff point of PCA was 76.06 mm2, with sensitivity of 83.0%, specificity of 83.1% and AUC of 0.94. PCA AUC (95% CI) =0.94 (0.90–0.97).