Figures & data
Figure 1 Bone turnover marker (TRAP-5b, total-P1NP) levels. TRAP-5b and total-P1NP levels increased immediately following discontinuation of denosumab.
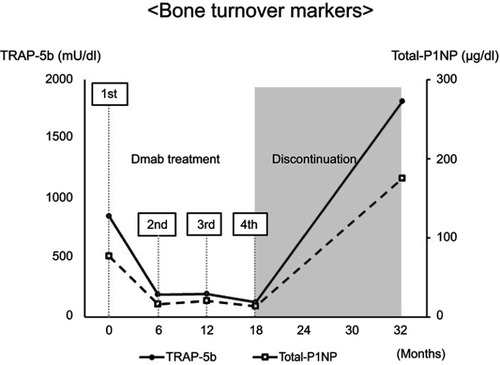
Figure 2 2D-BMD levels measured by DXA. DXA revealed that there was a significant decrease in bone mineral density after discontinuation of denosumab treatment.
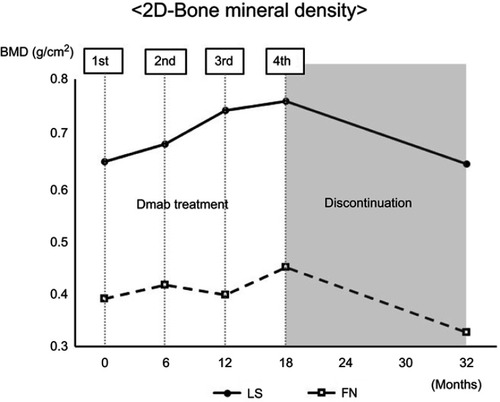
Figure 3 3D-BMD levels measured by QCT. QCT revealed that there was a significant decrease in bone mineral density after discontinuation of denosumab treatment.
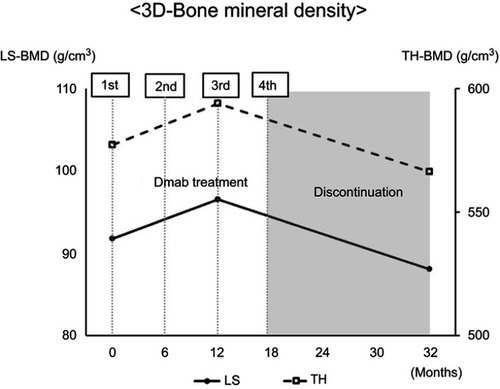
Figure 4 Cortical parameters of the hip measured by QCT. QCT revealed that the cortical parameter (cortical thickness and cortical BMD) decreased after discontinuation of denosumab treatment.
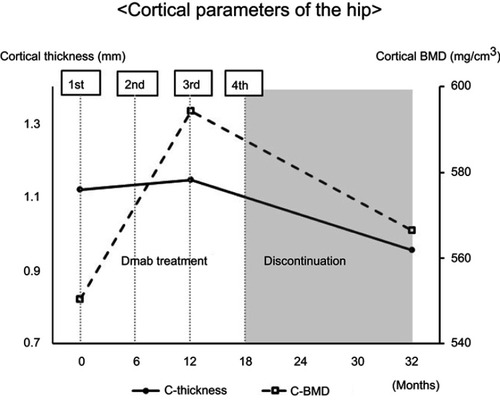
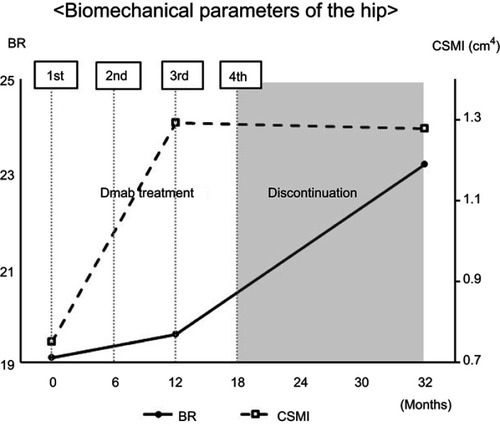
Figure 5 Biomechanical parameters of the hip measured by QCT. QCT revealed that the BR (index of cortical instability) increased and CSMI (index of bending strength) decreased after discontinuation of denosumab treatment.