
Figures & data
Table 1 The Content Of The Sage-atAge And Sage-atAge+ Service
Figure 1 Flowchart of study participation.
Notes:
aInclusion criteria: Groningen Frailty Indicator ≥4 and/or a care profile ≥2 Sage-atAge+ = the Sage-atAge service with the additional aim of increasing the involvement of the older adult through motivational interviewing and goal setting.
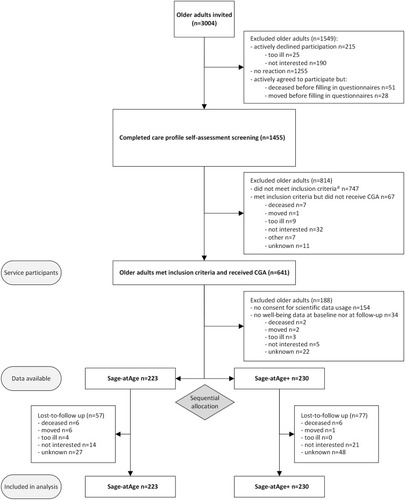
Table 2 Baseline Characteristics
Table 3 Linear Regression Models Of The Difference In General Well-Being Between The Two Service Options At Follow-Up
Data Availability
Data are available upon reasonable request to the first author.