Figures & data
Figure 1 ICA treatment alleviates spatial learning and cognitive deficits in APP/PS1 mice. (A) The latency retention; (B) Representative visible learning curve of mice on the fifth day; (C) The time in the target quadrant section; (D) The number of platform crossing times. *P<0.05 compared to WT, #P<0.05 compared to Tg.
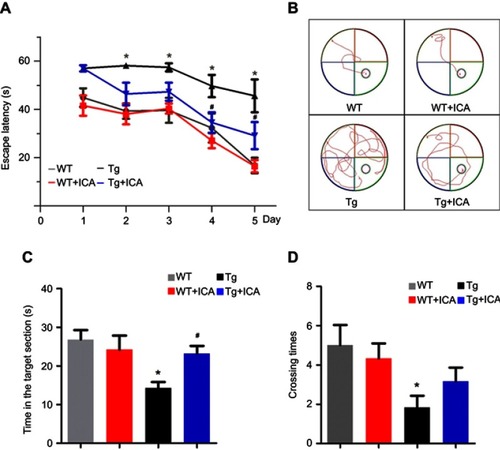
Figure 2 ELISA test shows reduced Aβ deposition after ICA treatment in hippocampus of Tg mice. (A) Insoluble Aβ40; (B) Insoluble Aβ42; (C) Soluble Aβ40; (D) Soluble Aβ42. *P<0.05 compared to WT, #P<0.05 compared to Tg.
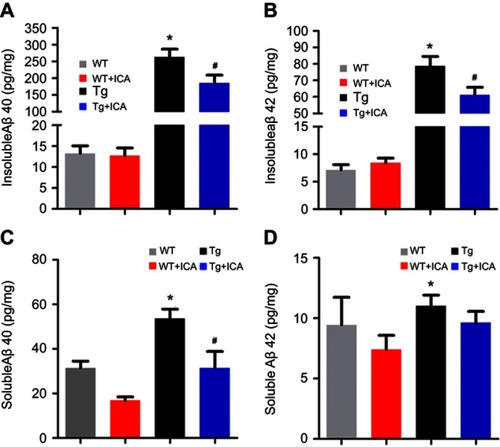
Figure 3 ICA treatment modulates the differentiation of CD4+ T cells in peripheral blood of APP/PS1 mice. Representative flow cytometry plots gated on T cells: (A) CD4+ T cells and CD8+ T cells; (B) Th1 cells identified by CD4+ and IFN-γ+; (C) Th2 identified by CD4+ and IL-4+; (D) Th17 identified by CD4+ and IL-17+; (E) Tregs identified by CD4+, CD25+ and FOXP3+. Percentages of T cells: (F) CD4+ T cells; (G) CD8+ T cells; (H) Th1 cells; (I) Th2 cells, (J) Th17 cells and (K) Tregs. *P<0.05 compared to WT, #P<0.05 compared to Tg.
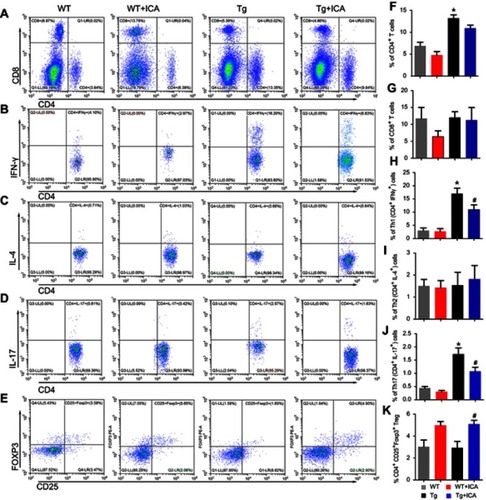
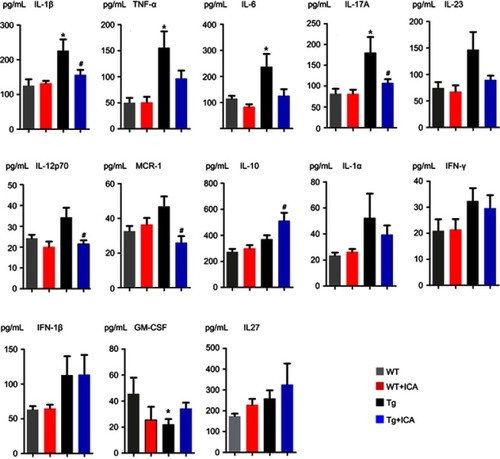
Figure 4 Alterations of cytokine levels in the plasma. *P<0.05 compared to WT, #P<0.05 compared to Tg.
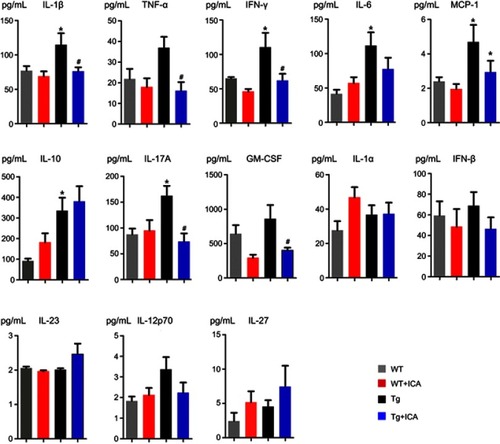
Figure 5 Alterations of cytokine levels in the brain homogenate. *P<0.05 compared to WT, #P<0.05 compared to Tg.