
Figures & data
Figure 1 Patient screening process.
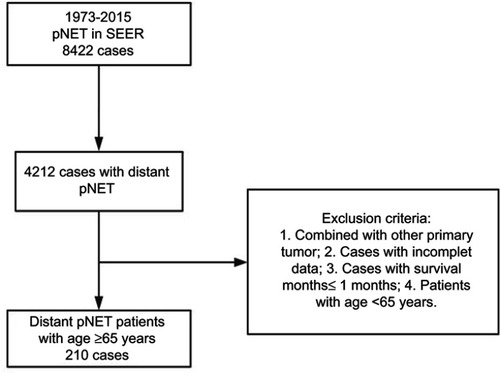
Table 1 Characteristics of patients older than 65 years included in the study
Table 2 Logistic regression analysis of characteristics for PSS in elderly patients (≥65 years)
Table 3 Multivariate regression analysis of characteristics for survival in elderly patients (≥65 years) before PSM
Table 4 Multivariate regression analysis of characteristics for survival in elderly patients (: Multfter PSM)
Figure 2 Overall survival and cancer-specific survival in elderly patients (≥65 years) with metastatic pNET who underwent primary site surgery (PSS) and no primary site surgery (NPSS), before and after propensity score matching (PSM).
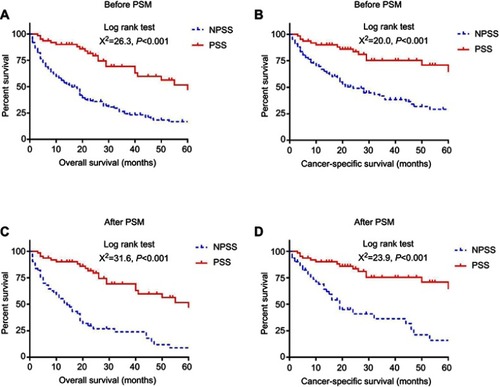
Figure 3 Kaplan–Meier analysis of cancer-specific survival for elderly patients (≥65 years) in sub-groups.
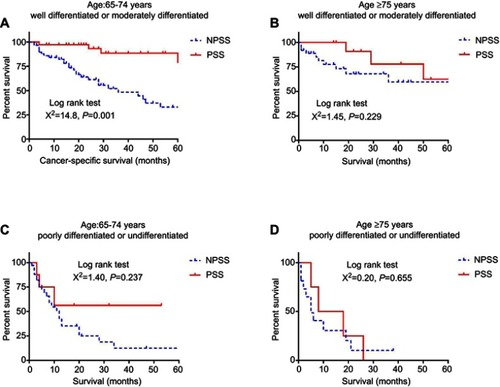
Table S1 Multivariate regression analysis of characteristics for cancer-specific survival in patients with age 65–74 years+ well or moderately differentiated
Table S2 Multivariate regression analysis of characteristics for cancer-specific survival in patients with age ≥75 years+ well or moderately differentiated
Table S3 Multivariate regression analysis of characteristics for cancer-specific survival in patients with age 65–74 years+ poorly differentiated or undifferentiated
Table S4 Multivariate regression analysis of characteristics for cancer-specific survival in patients with age ≥75 years+ poorly differentiated or undifferentiated