Figures & data
Table 1 Baseline of included studies
Figure 1 PRISMA flow chart of the literature screening and selection process.
Abbreviations: AD, Alzheimer's disease; RCTS, randomized controlled trials.
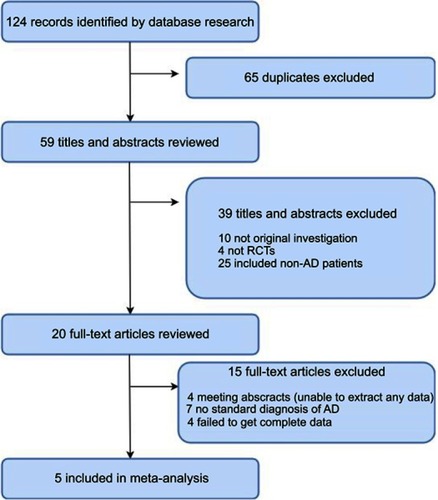
Figure 2 Risk of bias graph.
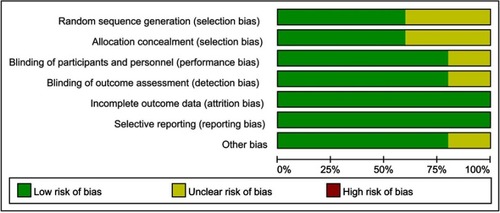
Figure 3 Risk of bias summary.
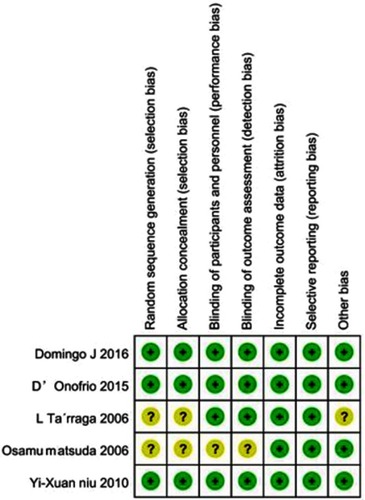
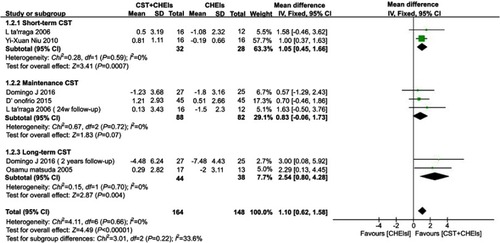
Figure 4 Forests plots for comparison of CST plus ChEIs versus ChEIs alone assessed by MMSE.
Abbreviations: CST, cognitive stimulation therapy; ChEIs, acetylcholinesterase inhibitor; MMSE, Mini-Mental State Examination.
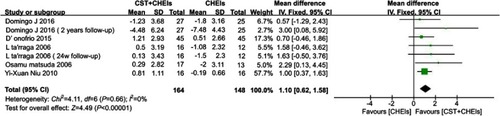
Figure 5 Forests plots for comparison of CST plus ChEIs versus ChEIs alone assessed by NPI.
Abbreviations: CST, cognitive stimulation therapy; ChEIs, acetylcholinesterase inhibitor; NPI, neuropsychiatric inventory.
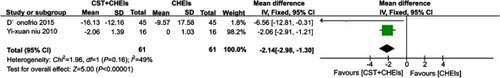
Figure 6 Forest plots for the comparison of short-term/maintenance/long-term CST plus ChEIs and ChEIs alone in MMSE.
Abbreviations: CST, cognitive stimulation therapy; ChEIs, acetylcholinesterase inhibitor; MMSE, Mini-Mental State Examination.