Figures & data
Table 1 The Mean And Standard Deviation Of Each Dimension Of Accumulation Deficits At Baseline By Sex (Number In Parentheses Is The Highest Score)
Table 2 The Mean And Standard Deviation Of Each Dimension Of Accumulation Deficits At Baseline By Survivorship At The End Of The Study (Number In Parentheses Is The Highest Score)
Table 3 The 5-Year Transition Probability Between States Of Frailty With Or Without Depressive Symptoms For All Individuals And By Sex
Table 4 The 20-Year Transition Probability Between States Of Frailty With Or Without Depressive Symptoms For All Individuals And By Sex
Figure 1 Twenty-year survival probability of 3 frailty states (defined by accumulation deficits) with (dashed line) or without depressive symptoms (solid line) for males and females.
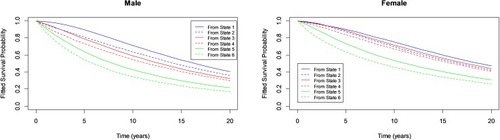
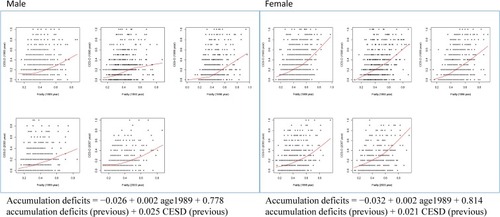
Figure 2 Relationship between baseline age, previous accumulation deficits, depressive scores, and current depressive score by males and females.
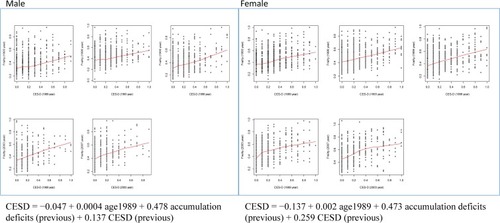
Figure 3 Relationship between baseline age, previous accumulation deficits, depressive scores, and current accumulation deficits by males and females.