
Figures & data
Table 1 Clinical and Demographic Characteristics of the Patient Cohort
Figure 1 Patients included in comparisons between fallers and non-fallers; and for the generalised linear mixed effects model analyses.
Notes: *Two patients fell during these readmissions (and had not fallen on the first admission). **Two of these patients fell while in an included ward.
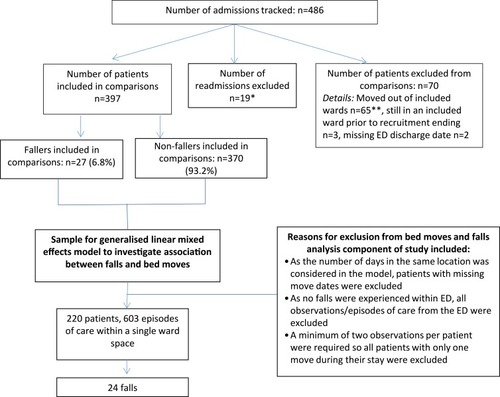
Table 2 Multivariate Logistic Regression Results: Experienced a Fall During Hospital Admission (Event=“Yes”)
Table 3 Environmental Audit Scores (Median Number of Falls Risk Hazard Types Identified, and Most Common Hazards Identified)
Table 4 Scores for the Person-Centred Care of Older People with Cognitive Impairment in Acute Care Scale (POPAC), the Person-Centred Health Care for Older Adults Survey (PCHCOAS), and the Assessment of Interprofessional Team Collaboration Scale.
Table 5 Focus Group Participant Characteristics