
Figures & data
Figure 1 Prevalence of SA, UA, and MCI according to total population and gender. p>0.1 for chi-square analysis of the association between gender and cognitive status.
Abbreviations: SA, successful aging; UA, usual aging; MCI, mild cognitive impairment.
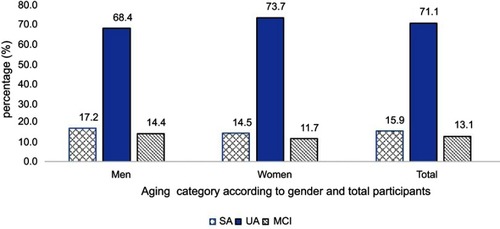
Table 1 Socio-demography characteristic and self-reported medical history of subjects
Table 2 Types of sugar intake and aging category
Table 3 Mean ± SD cognitive functions tests according to the percentile of total sugar intake
Table 4 Mean ± SD cognitive functions tests according to the percentile of free sugar intake
Table 5 Multivariate-adjusted OR and 95% CI for cognitive impairment (MMSE <24) according to quintile of various sugar intake