Figures & data
Figure 1 Study flow chart previously provided as supporting online information in Ballin et al 2019.Citation27
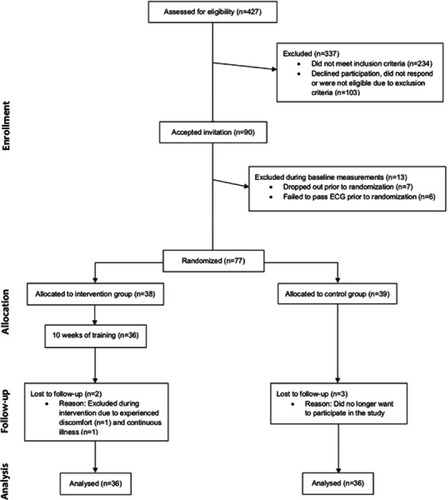
Table 1 Changes in outcomes during the 10-week study period
Figure 2 Mean changes and 95% confidence intervals for SF-36 raw scores across all subscales and component summaries from baseline to follow-up for the intervention group compared to the control group. P-values are derived from ANCOVA on mean change from baseline to follow-up adjusted for baseline values.
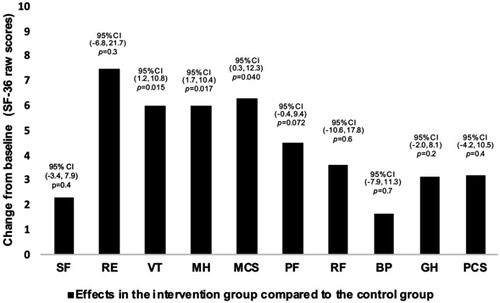
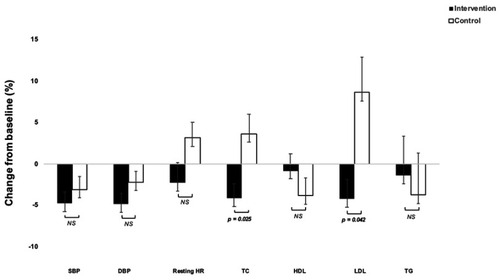
Figure 3 Mean percentage changes in cardiometabolic risk markers in the study groups following the 10-week intervention period. Error bars represent standard errors of the mean. P-values are derived from ANCOVAs on mean change from baseline to follow-up in percent adjusted for baseline values.