
Figures & data
Table 1 NPI-sleep questions
Figure 1 Pipeline of the statistical analyses.
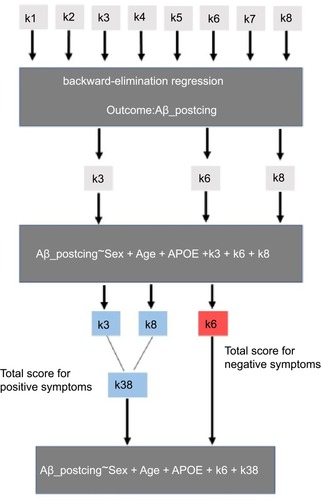
Table 2 Subject characteristics
Table 3 NPI-sleep symptoms (columns) in the strongest models for predicting regional Aβ burden (rows). Non-empty cells indicate the presence of the symptom (positive or negative correlation) in the strongest model determined by the backward-elimination process
Table 4 NPI-sleep symptoms (columns) in the strongest models for predicting regional tau burden (rows). Non-empty cells indicate the presence of the symptom (positive or negative correlation) in the strongest model determined by the backward-elimination process
Figure 2 Global Aβ PET and left entorhinal tau SUVR values in subject groups stratified by the presence/absence of symptoms with positive coefficients (k35 for Aβ in A, k358 for tau in C) and negative coefficients (k6 for Aβ in B and k126 for tau in D).
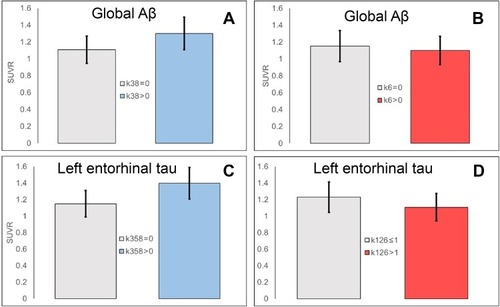
Table 5 Regression analyses with total scores. For regional A