
Figures & data
Figure 1 Study recruitment flow diagram.
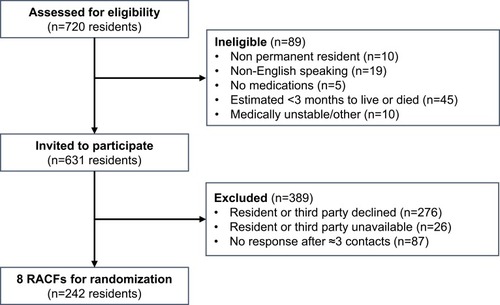
Table 1 Baseline Characteristics Of SIMPLER Participants
Figure 2 Scatter plot of Medication Regimen Complexity Index (MRCI) score versus daily administration times with linear regression lines.
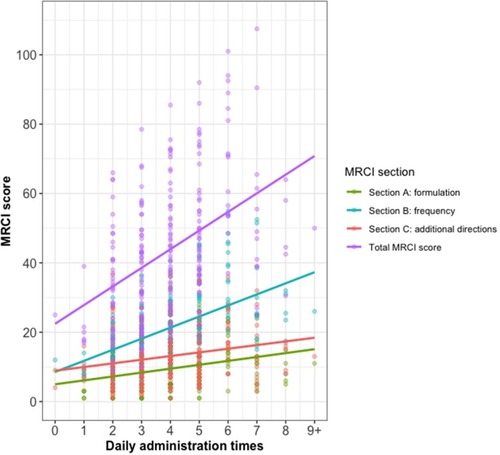
Figure 3 Plots of correlation of daily administration times with (A) age, (B) length of stay, (C) Charlson Comorbidity Index (CCI) score, (D) Dementia Severity Rating Scale (DSRS) score, (E) Frailty in Nursing Homes (FRAIL-NH) score, and (F) Katz Index of Independence in Activities of Daily Living (Katz-ADL) score, reversed to score for dependence. Solid lines: linear regression line; shaded areas: 95% confidence intervals. *Missing for n=2.

Figure 4 Plots of correlation of Medication Regimen Complexity Index (MRCI) score with (A) age, (B) length of stay, (C) Charlson Comorbidity Index (CCI) score, (D) Dementia Severity Rating Scale (DSRS) score, (E) Frailty in Nursing Homes (FRAIL-NH) score, and (F) Katz Index of Independence in Activities of Daily Living (Katz-ADL) score, reversed to score for dependence. Solid lines: linear regression line; shaded areas: 95% confidence intervals. *Missing for n=2.
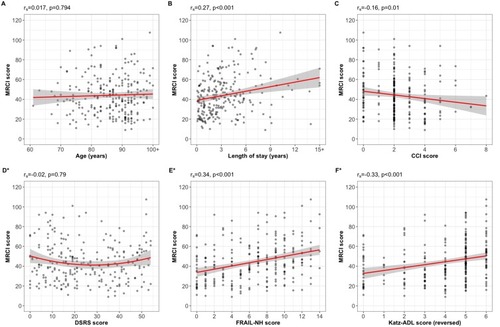
Table 2 Univariate And Multivariate Logistic Regression Analysis