Figures & data
Table 1 Baseline Characteristics Of Participants
Table 2 Determinants Of E/E’ By Multiple Linear Regression Analysis
Table 3 Age- And Gender-Adjusted Multivariate Logistic Analyses
Table 4 Independent Risk Factors Of LVDD-PEF According To Multivariate Logistic Analysis
Table 5 Details Of Differentially Methylated Regions Between Two Groups
Table 6 Candidate Genes Selected For Validation
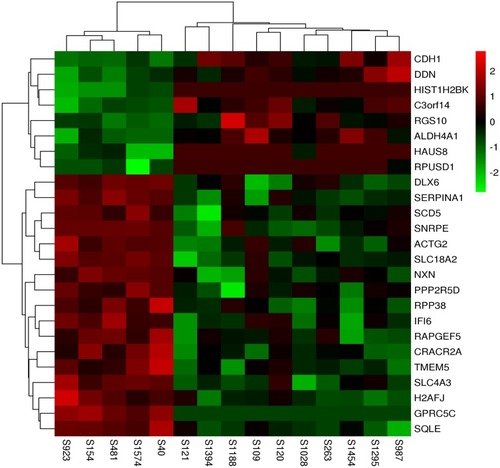
Figure 1 Cluster analysis of genes with significantly altered methylation for upstream (n=25). Each column represents a sample, and each row represents the methylation level of a gene. The color code for the heatmap is displayed in the upper right corner, values range from −2 (sample with the lowest methylation for the considered genes) to 2 (sample with the highest methylation for the considered genes).