Figures & data
Table 1 Baseline characteristics of included participants reported as median (IQR)
Table 2 Pre- and post-program results in physical performance and subjective measures for EX, Balance Rehabilitation Unit (BRU) and non-intervention groups
Table 3 Pre- and post-program results for the posturography assessment in the exercise and Balance Rehabilitation Unit (BRU) and non-intervention groups
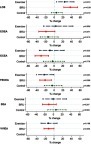
Figure 1 Percentage change for handgrip strength, five time sit to stand (5 STS), timed up and go (TUG), four square step test (FSST) and falls efficacy scale (FES-I) assessments. Absolute change included for gait speed. p-values for comparisons between pre and post intervention are listed on the right hand side for each intervention. Significant difference was found between the exercise and BRU groups compared to control (non-intervention) for handgrip strength, TUG, gait speed and fear of falling (FES-I) assessments.
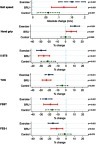
Figure 2 Percentage change for the posturography assessment results for limits of stability (LOS) and ellipse areas for the following tasks: eyes open (EOEA), eyes closed task (ECEA), foam eyes closed (FECEA), saccadic (SEA), visuo-vestibular interaction (VVIEA). p-values for comparisons between pre and post intervention are listed on the right hand side for each intervention. Although the BRU group reported larger and more significant changes, only improvements in limits of stability were significantly different between groups.