Figures & data
Table 1 Demographic Characteristics, Coexisting Medical Conditions And Indications For TEVAR
Table 2 Details Of The Operation, Aortic Stent-Grafts And Chimney Stents
Figure 1 Chimney stent was deployed as a bailout to reconstruct the LCCA. TBAD was confirmed by preoperative CTA (A). The aortic stent-graft was planned to deploy between LCCA and LSA (yellow arrow) (B), but the ostia of LCCA was partially covered (blue arrow) accidentally (C). Double chimney technique (LCCA + LSA) was conducted (D), and postoperative CTA showed that both chimney stents were patent without endoleak at 6 months follow-up (E and F).
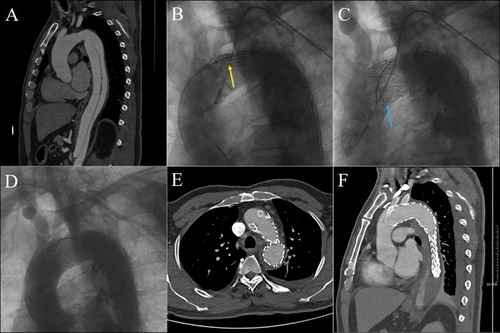
Table 3 Early- And Mid-Term Outcomes Of Chimney Technique For Aortic Arch Diseases
Table 4 Details Of The Chimney Stent Occlusions
Table 5 Details Of Preoperative CTA And Follow-Up CTA
Figure 2 Kaplan–Meier curves among patients with zone 0, zone 1 and zone 2 aortic arch diseases. Cumulative all-cause death curves (A), aorta-specific death curves (B) and major adverse event curves (C) in patients with zone 0, zone 1 and zone 2 aortic arch diseases. The number of patients at risk at each year was listed in the bottom of the figure.
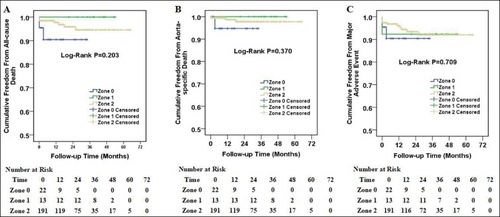
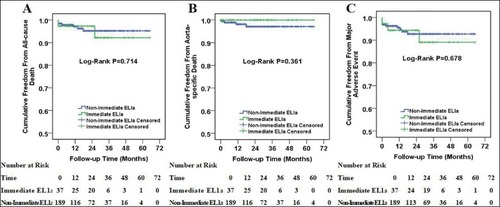
Figure 3 Kaplan–Meier curves among patients with immediate type Ia endoleak and non-immediate type Ia endoleak. Cumulative all-cause death curves (A), aorta-specific death curves (B) and major adverse event curves (C) in patients with immediate type Ia endoleak and non-immediate type Ia endoleak. The number of patients at risk at each year was listed in the bottom of the figure.