
Figures & data
Table 1 Characteristics of the Patients Stratified into a Younger and an Older Group According to the Median Age of the Patients of 82.98 Years
Table 2 Force Plate Variables and the Frailty Phenotype (FP)
Table 3 Force Plate Variables and the Clinical Frailty Scale (CFS)
Table 4 Force Plate Variables and the 14-Item Frailty Index Based on a Comprehensive Geriatricassessment (FI-CGA)
Table 5 Force Plate Variables and the Frailty Index (FI)
Figure 1 Association between length of sway during the task wide stand eyes open (WSEO) and frailty status according to the frailty phenotype (P = 0.014).
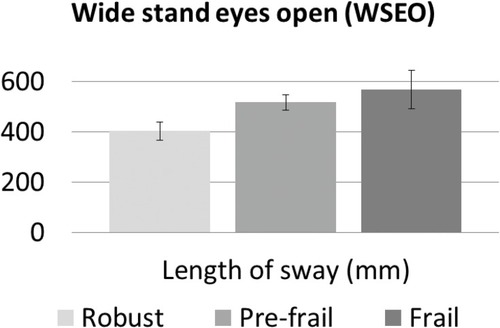
Figure 2 Association between length of sway during the task narrow stand eyes open (NSEO) and frailty status according to the clinical frailty scale (CFS) (P = 0.034).
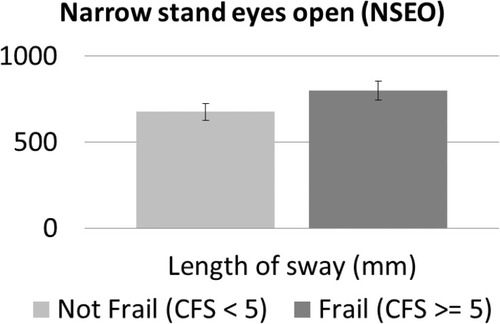
Figure 3 Association between length of sway during the task wide stand, eyes open (NSEO) and frailty status, according to the frailty index based on a comprehensive geriatric assessment (FI-CGA) (P = 0.014).
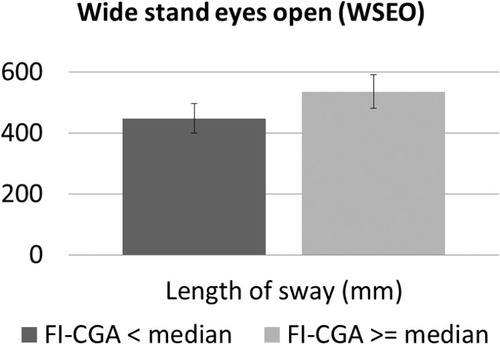
Figure 4 Association between length of sway during the task narrow stand, eyes open (NSEO) and frailty status according to the frailty index (FI) (P = 0.007).
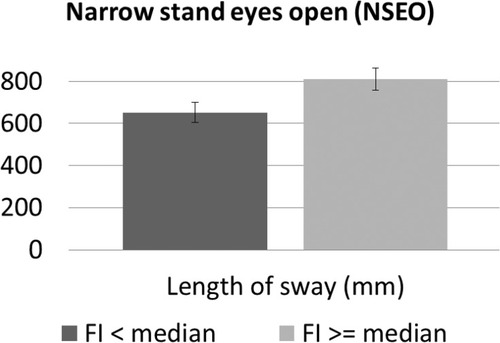
Table 6 Correlation Analysis Between Force Plate Variables and the Four Different Frailty Instruments
Table 7 Force Plate Variables and Risk Factors for Frailty Part 1
Table 8 Force Plate Variables and Risk Factors for Frailty Part 2
Table 9 Correlation Between Force Plate Variables and Risk Factors for Frailty