Figures & data
Figure 1 Effect of the transplantation of lymphocytes co-cultured with HCB-SCs on neurological deficits at 48 hrs after stroke in rats. (A): Burderson’s score. (B): Sensorimotor function test by tape removal. *P<0.05 vs Sham group; #P<0.05 vs tMCAO group.
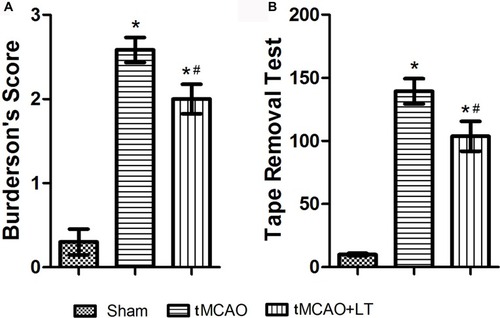
Figure 2 Effect of the transplantation of lymphocytes co-cultured with HCB-SCs on infarct volume. (A): Representative images of TTC-stained brains at 48 hrs after stroke. (B): Quantification of brain infarct volume. *P<0.05 vs Sham group; #P<0.05 vs tMCAO group.
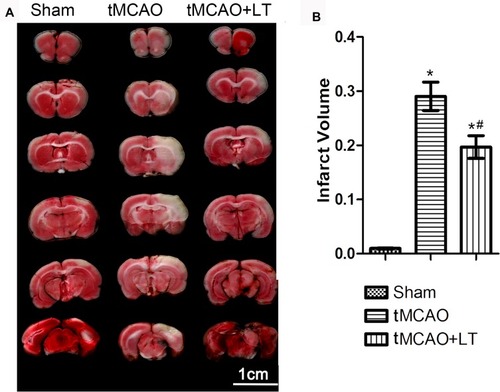
Figure 3 Effect of the transplantation of lymphocytes co-cultured with HCB-SCs on modulating the differentiation of Tregs. Representative flow cytometry plots gated on CD4+CD25+ T cells (A) and CD4+CD25+Foxp3+ T cells (B). Percentages of CD4+CD25+ T cells (C) and CD4+CD25+Foxp3+ T cells (D). *P<0.05 vs Sham group; #P<0.05 vs tMCAO group.
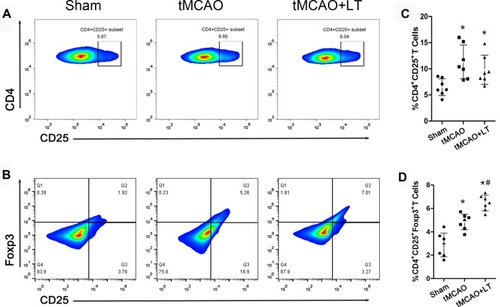
Figure 4 Effect of the transplantation of lymphocytes co-cultured with HCB-SCs on the inflammatory activity. Western blot shows the protein levels of caspase-1 (A), mature IL-1β (B), NLRP3 (C), NLRP1 (D), p-ERK/ERK (E), NF-κB p-P65/P65 (F), and cleaved caspase-3 (G). The NF-κB specific band is located at 65 kDa, and a nonspecific band can be seen at a molecular weight of 72 kDa (F). *P<0.05 vs Sham group; #P<0.05 vs tMCAO group.
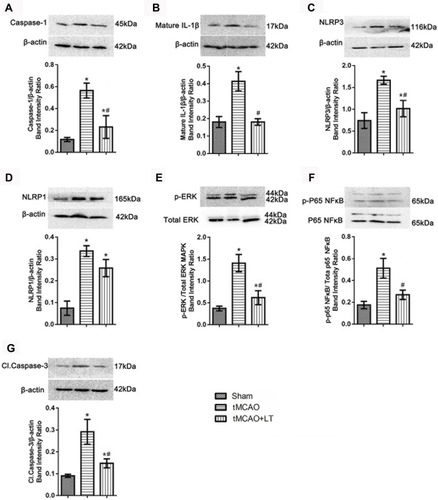
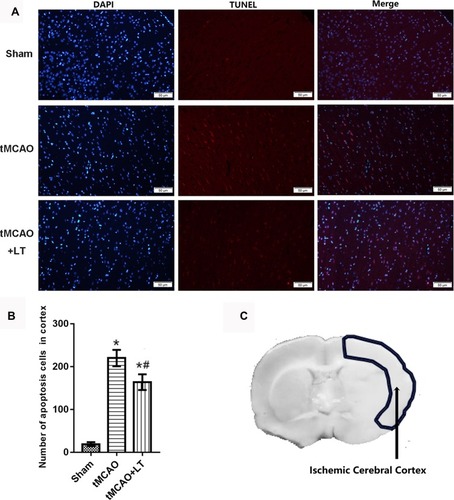
Figure 5 Effect of the transplantation of lymphocytes co-cultured with HCB-SCs on cell apoptosis in the ischemic cerebral cortex. TUNEL staining is used to analyze number of apoptosis cells in cerebral cortex. Representative images of TUNEL staining (A). The statistical graph of the number of apoptosis cells (B). Schematic of the brain shows the detection region (C). *P<0.05 vs Sham group; #P<0.05 vs tMCAO group.