
Figures & data
Figure 1 Flow chart of the study cohort.
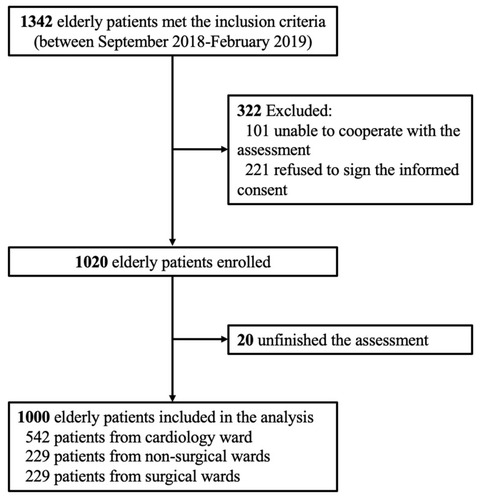
Table 1 Demographic and Clinical Characteristics of All Participants
Figure 2 Frailty prevalence in different wards by different measurements.
Abbreviations: CFS, clinical frailty scale; FI, frailty index.
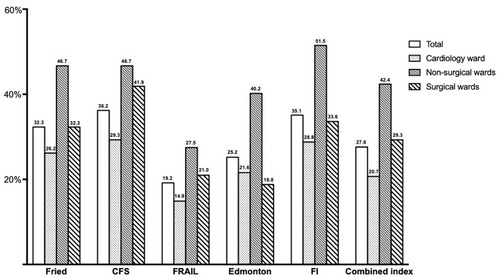
Table 2 Sensitivity and Specificity of Different Frailty Tools in Identifying Frailty According to the Combined Index (the Presumed Gold Standard for Identifying Frailty) in Different Wards
Table 3 Risk Factors Associated with Frailty of All Patients by Univariable and Multivariable Logistic Regression