
Figures & data
Figure 1 Participants’ flow through the study.
Abbreviations: DSM-BIA, direct-segmental multi-frequency bioimpedance analysis; DXA, dual-energy X-ray absorptiometry; HI-RT, high-intensity resistance training; CG, control group; FU, follow-up; ITT, intention to treat.
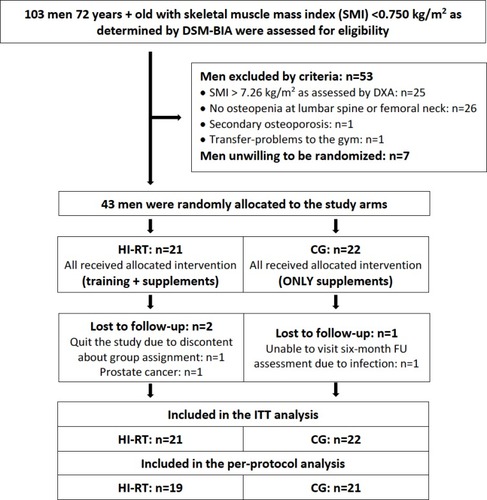
Figure 2 Exercise protocol.
Abbreviations: reps, repetitions; con, concentric; iso, isometric; ecc, eccentric; nRM, non-repetition maximum; RM, one-repetition maximum.
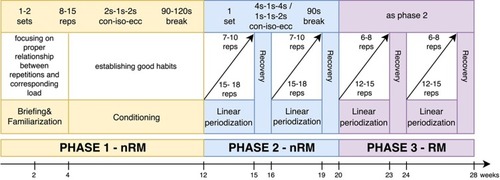
Table 1 Baseline Characteristics of the Participants of the CG and HI-RT Group
Table 2 Baseline Data and Changes in the Sarcopenia Z-Score in the GC and HI-RT and Corresponding Between-Group Differences
Table 3 Baseline Data and Changes in the Sarcopenia Criteria in the Control Group (CG) and High-Intensity Resistance Training Group (HI-RT) and Corresponding Between-Group Differences
Table 4 Changes in Potentially Confounding Parameters in the CG and HI-RT and Corresponding Between-Group Differences