Figures & data
Figure 1 Radiographs showing advanced lumbar spinal degeneration, with reduced height of the L5-S1intervertebral space (A) and extensive osteophytes (A, B arrows).
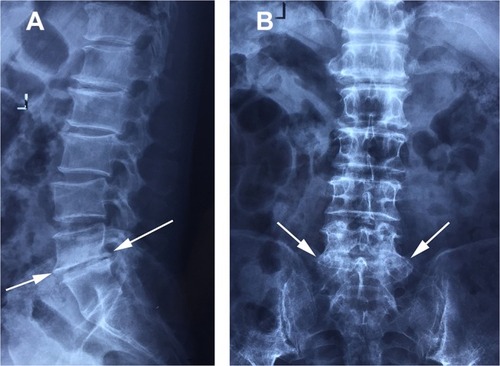
Figure 2 Sagittal (A) and axial (B) magnetic resonance imaging showing a large herniated disc at L4-L5 level.
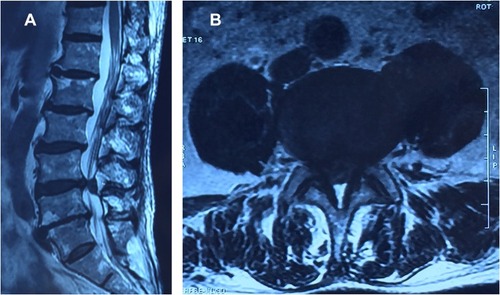
Figure 3 A large cauliflower-like mass (white arrow) was found near the arachnoid membrane (black arrow). C indicates cranial side.
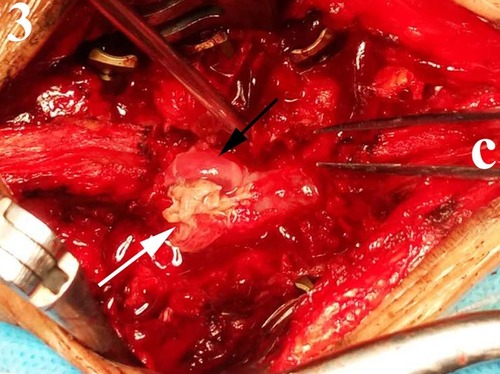
Figure 4 Posterior fixation and fusion at the L4-L5 level.
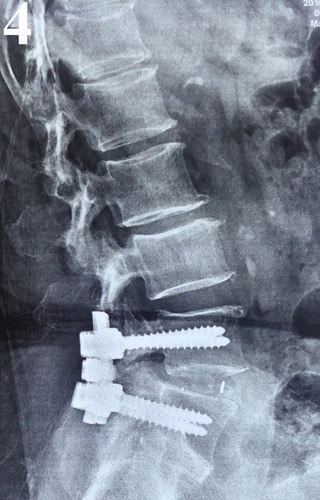
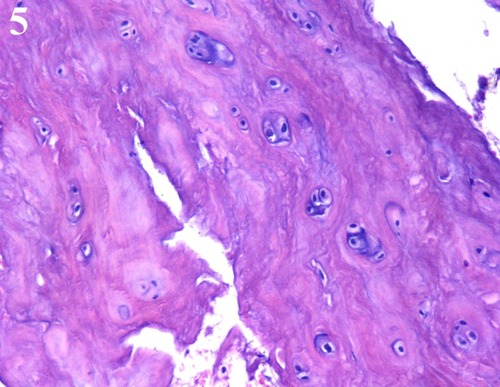
Figure 5 The pathological examination revealing disc tissue (hematoxylin and eosin stain, ×100).