Figures & data
Figure 1 Flowchart presenting the acquisition of participants.
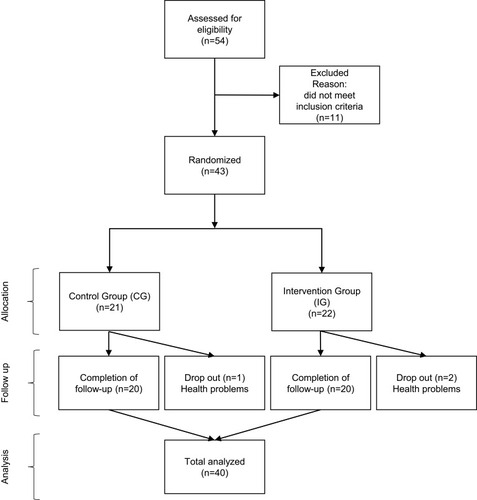
Figure 2 The used mini-trampoline in the training intervention program.
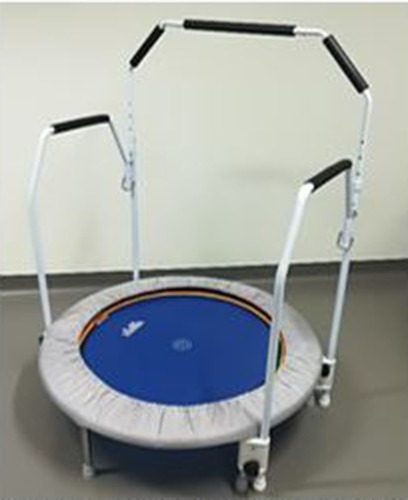
Table 1 Baseline Characteristics of Study Participants
Table 2 Comparison of Pre- and Post-Test Results Between IG and CG
Figure 3 Gait speed measured within WT of IG and CG at pre- and post-tests; *Significant difference between pre- and post-test (p<0.05); **Significant difference between groups (p<0.05); Data are presented as mean values ± standard deviations of the WT test measurements before (pre) and after (post) the exercise intervention program.
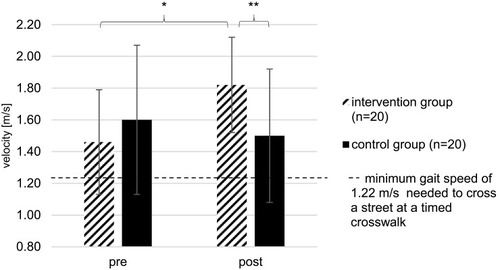
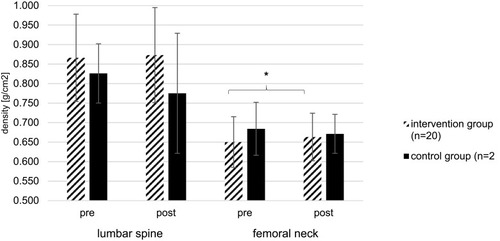
Figure 4 BMD measured at lumbar spine and femoral neck of IG and CG at pre- and post-tests; *Significant difference between pre- and post-test (p<0.05); Data are presented as mean values ± standard deviations of the BMD test measurements before (pre) and after (post) the exercise intervention program.