Figures & data
Table 1 Baseline Clinical Characteristics and Laboratory Data of the Study Population
Table 2 Plasma IL37 Levels in Different Stroke Subtypes
Figure 1 Plasma IL-37 levels of patients with AIS and normal control subjects. Horizontal lines represent median levels. P values indicate differences between groups determined by the Mann–Whitney U-test.
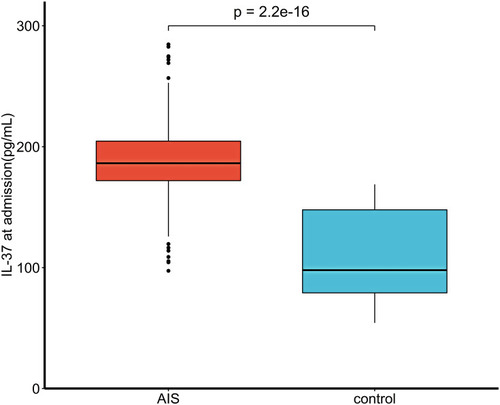
Figure 2 Plasma IL-37 levels in different stroke subtypes and normal control subjects. Horizontal lines in box plots represent median levels. Box areas represent the interquartile range, and whiskers indicate the minimum to maximum values. P values indicate differences between groups determined by Mann–Whitney U-test.
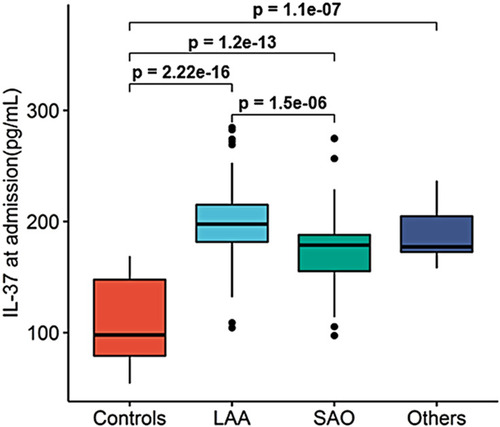
Figure 3 Correlation between plasma IL-37 level and lesion volumes. P values were determined using Spearman correlation analysis.
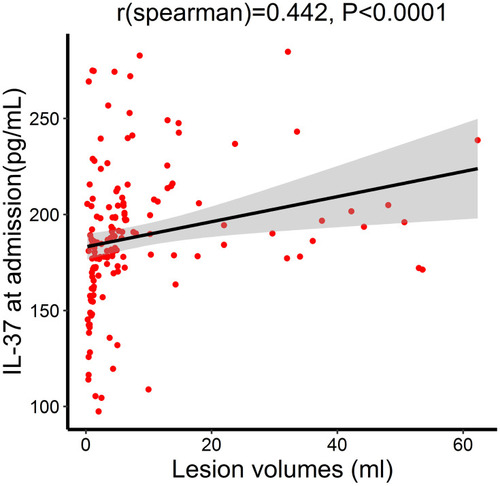
Figure 4 Correlation between plasma IL-37 level and NIHSS score. P values were determined using Spearman correlation analysis.
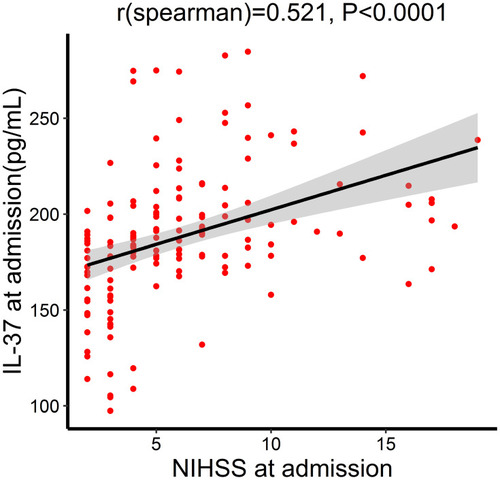
Table 3 Logistic Regression Analysis for Three Months Outcome
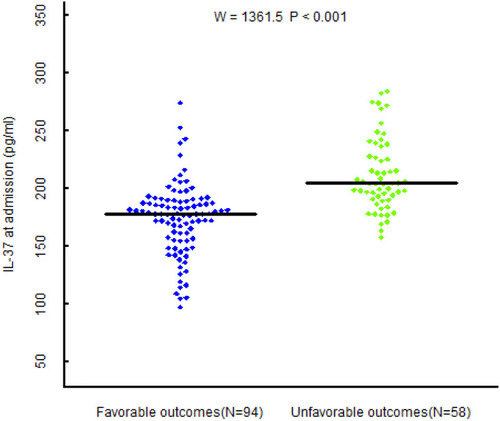
Figure 5 Plasma IL-37 levels of patients with favorable and unfavorable outcomes. Horizontal lines represent median levels. P values indicate differences between groups determined by the Mann–Whitney U-test.