Figures & data
Table 1 Demographic variables
Figure 1 Range of motion in terms of active flexion of hip: knee flexion.
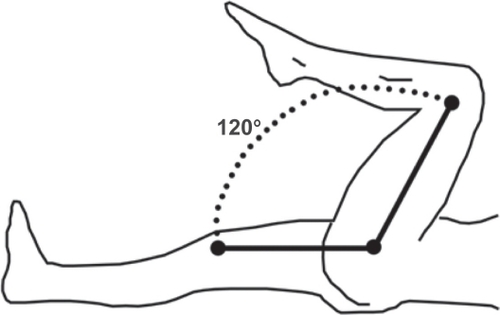
Figure 2 Range of motion in terms of active flexion of hip: knee extension.
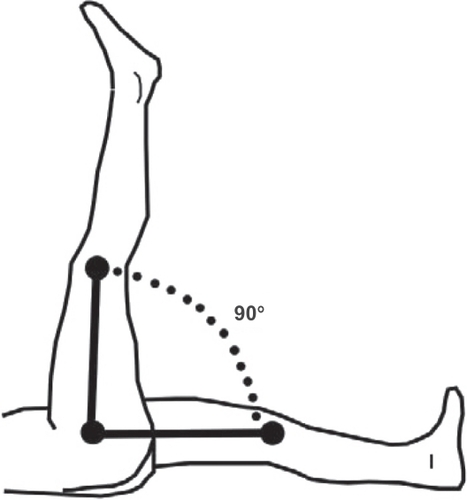
Figure 3 Additional graph for : mean of the pain variation in VAS scale before and after the two treatments (hyperthermia/REAC).
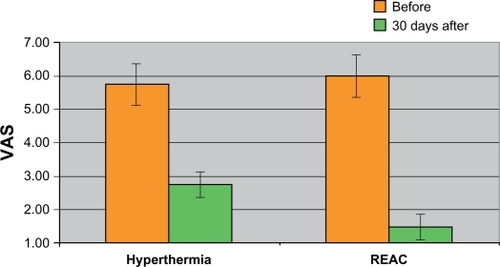
Figure 4 Additional graph for : mean of the hip-bending angle with the knee flexed before and after the two treatments (hyperthermia/REAC) (normal angle = 120°).
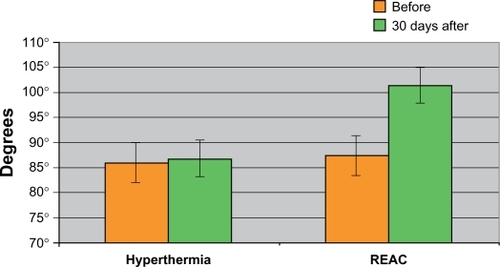
Figure 5 Additional graph for : mean of the hip-bending angle with the knee extended before and after the two treatments (hyperthermia/REAC) (normal angle = 90°).
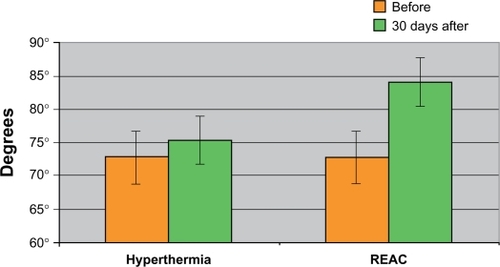
Table 2 Pain variation before and 30 days after the two treatments
Table 3 Active flexion of hip with knee flexed (normal range 120°) before and 30 days after the two treatments
Table 4 Active flexion of hip with knee extended (normal range 90°) before and 30 days after the two treatments
Table 5 Statistical analysis using Wilcoxon signed-rank test and sign-test