
Figures & data

Figure 1 Flow diagram for study participants.
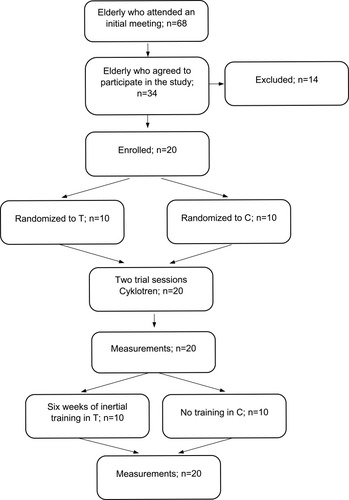
Figure 2 Subject position during inertial training. (A) elbow flexors exercise. (B) knee flexors exercise.
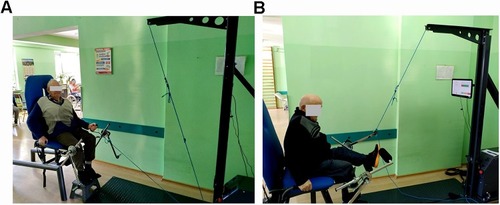
Table 1 Mean Percentage Changes, Standard Deviations, 95% Confidence Intervals, and Effect Sizes for Force Measured Using Cyklotren
Table 2 Mean and Standard Deviations for Absolute Values of Force Measured Using Cyklotren
Table 3 Mean Percentage Changes, Standard Deviations, 95% Confidence Intervals, and Effect Sizes for Analyzed Functional Parameters
Table 4 Mean and Standard Deviations for Absolute Values of Analyzed Functional Parameters