Figures & data
Figure 1 EEG showed epileptiform discharge (red arrows) and Chest CT showed a tumor in the hilus of the left lung (red arrow).
Notes: (A) EEG. (B) Chest CT.
Abbreviations: EEG, Electroencephalogram; CT, computed tomography.
Abbreviations: EEG, Electroencephalogram; CT, computed tomography.
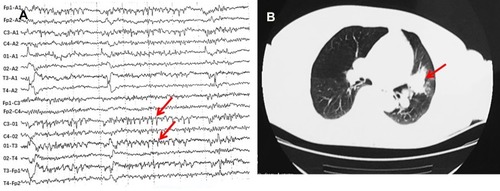
Figure 2 Images from the magnetic resonance imaging after admission.
Notes: (A) T1-weighted sequences showed hypointensity in left hippocampus (red arrow). (B) T2-weighted sequences showed hyperintensitiy in left hippocampus (red arrow). (C) FLAIR showed hyperintensitiy in left hippocampus (red arrow). (D) Postcontrast enhanced image revealed no obvious enhancement of lesions.
Abbreviation: FLAIR, fluid-attenuated inversion recovery.
Abbreviation: FLAIR, fluid-attenuated inversion recovery.
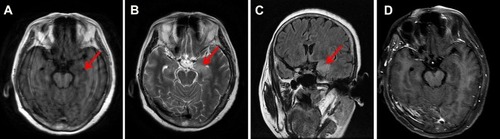
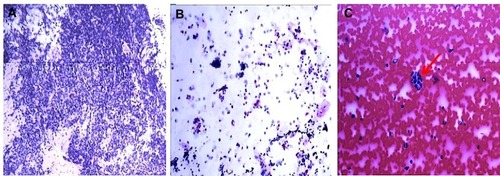
Figure 3 Pathological examination.
Notes: (A) Biopsy of Lung (Wright staining, magnificationx40). (B) Cytological examination of lung lavage fluid (Wright staining, magnificationx100). (C) Biopsy of left bronchial mucosal (Wright staining, magnificationx400), small tumor circle cells (red arrow).