Figures & data
Figure 1 Quantification of the thickness of the vascular wall of aortic rings of YO, AD and OL rabbits. Results on average ± SEM. The number of experiments is 4 in all cases.
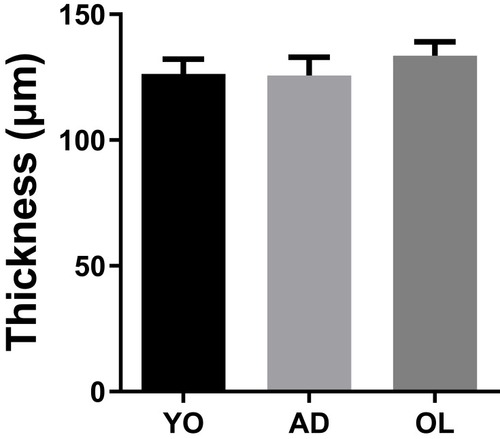
Table 1 pD2 and Emax to KCl, FE, U-46619, CCh Isoproterenol and SNP in Aortic Rings in YO, AD, and OL Rabbits
Figure 2 Concentration–response curves to KCl (A), PE (B) and U-46619 (C). YO (●, 4 animals, 8 rings), AD (■, 4,8) and OL (▲, 4,8). δ indicates a higher sensitivity to KCl and lower Emax to PE in YO arteries, compared to AD and OL. ψ indicates a higher sensitivity to KCl and to U-46619, and a higher Emax to U-46619, in YO and AD arteries compared with OL. In panel B, ε indicates a higher sensitivity to PE in AD, compared to YO and OL. pD2 and Emax values in all conditions can be seen in . Significance level of P<0.05.
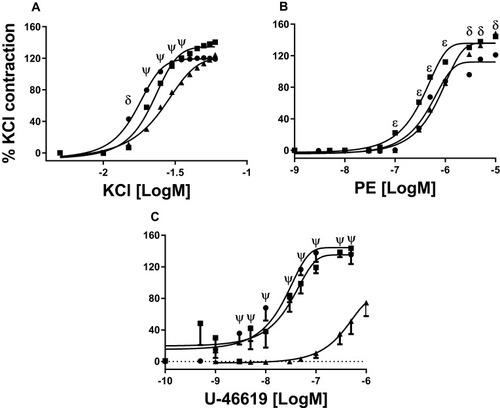
Figure 3 Concentration–response curves to CCh (A), isoproterenol (B) and SNP (C). YO (●, 4 animals, 8 rings), AD (■, 4,8) and OL (▲, 4,8). δ indicates a lower sensitivity in YO to CCh than AD and higher than OL, and a higher sensitivity to isoproterenol and SNP and higher Emax to isoproterenol in YO compared with AD and OL. ψ indicates a higher sensitivity to CCh in YO and AD compared with OL. ϕ indicates a higher sensitivity to CCh and isoproterenol and higher Emax to isoproterenol in AD compared with YO and OL. γ indicates a lower sensitivity in AD to SNP than YO. λ indicates a lower relaxation in OL to SNP than YO. pD2 and Emax values in all conditions can be seen in . Significance level of P<0.05.
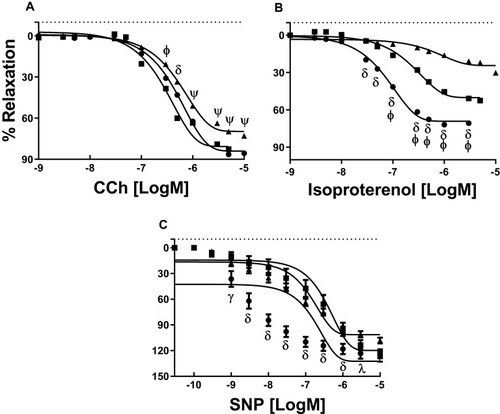
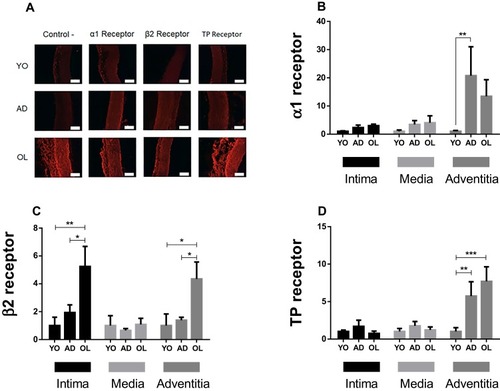
Figure 4 Quantification of protein expression of α1, β2 and thromboxane A2 (TP) receptors in the aortic wall of YO, AD, and OL rabbit. (A) representative images of immunofluorescence to identify α1, β2 and thromboxane A2 (TP) receptors. (B–D) Quantification of the fluorescence of the α1, β2 and TP receptors, respectively, in the tunica of the aortic wall. The number of experiments is 4 in all cases. (A) The length of the white calibration bars are equivalent to 100 μm. *Indicates p<0.05. **p<0.01. ***p<0.001. The expression was always normalized to YO.