
Figures & data
Figure 1 The North Dublin community virtual ward (CVW) assessment and triage process.
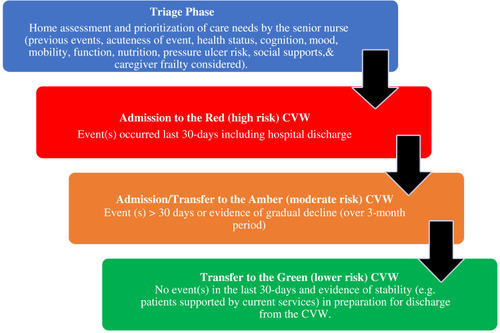
Table 1 Health States Measured at 30, 60 and 90 Days After Admission to the Community Virtual Ward
Table 2 Summary of Data Items and Scales Collected as Part of the Community Virtual Ward (CVW) Model
Table 3 Typical Events and Interventions Applied as Part of the North Dublin Community
Table 4 Characteristics of Patient Included in the Community Virtual Ward
Table 5 Multinomial Logit Regression Analysis Factors Associated with Institutionalization
Table 6 Health States Measured at 30 and 60 Days and Outcomes