Figures & data
Table 1 General Characteristics of Low-Density Lipoprotein Cholesterol Among Hainan Female Centenarians
Table 2 General Characteristics of Triglyceride Among Hainan Female Centenarians
Table 3 General Characteristics of High-Density Lipoprotein Cholesterol Among Hainan Female Centenarians
Figure 1 With the aggravation of ADL disability, the levels of LDL-C, TG, HDL-C appear to have a significant downward trend in female centenarians.
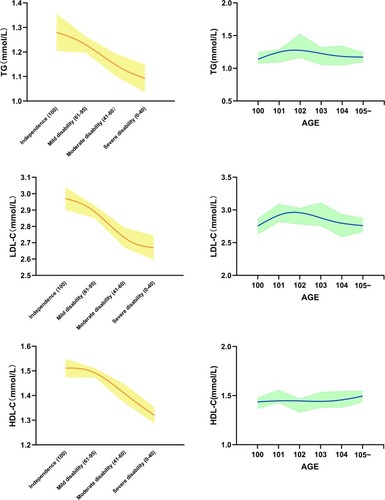
Table 4 The Odds Ratios (ORs) for ADL Disability in Different Lipids Profiles Indicators
Table 5 Association Between LDL-C, TG and HDL-C and ADL Disability in Hainan Female Centenarians
Table 6 Association Between LDL-C, TG and HDL-C and ADL Disability in Hainan Female Centenarians in Different Models
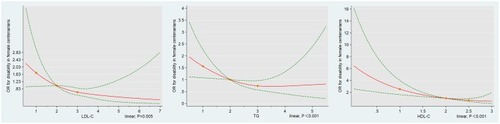
Figure 2 Restrictive cubic splines are used to visualize and analyze the correlation between ADL disability and LDL-C, TG and HDL-C levels.