
Figures & data
Table 1 Demographic Data and Hearing Status of 170 Older Adults as Group Mean and Standard Deviation
Figure 1 A flow chart of the experiment procedures.
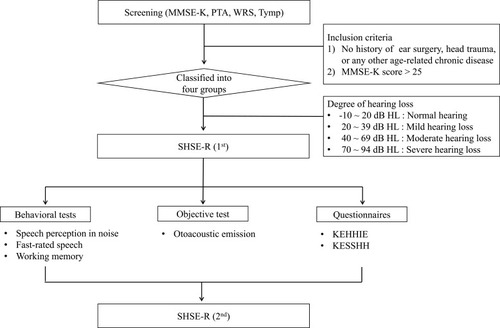
Figure 2 Comparison of test and retest scores for SHSE-R as a function of hearing levels.
Notes: *p<0.05, †p<0.01.
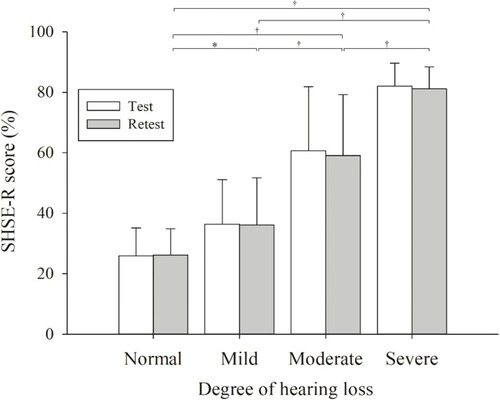
Table 2 Correlation of Each Subcategory and Total Score with Three Hearing Tests
Table 3 Components Loadings from the EFA for the 20 Items of the SHSE-R