Figures & data
Table 1 Participants’ Characteristics (n=280)
Table 2 Characteristics of Health-Related Quality of Life (n=280)
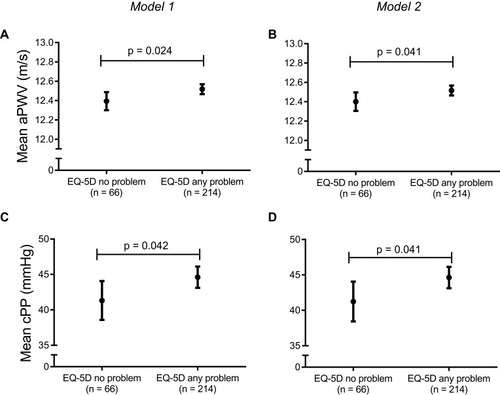
Figure 1 Mean values of aortic stiffness according to EQ-5D index status (n=280).
Notes: (A and B): aortic Pulse Wave Velocity (aPWV) in m/s; (C and D): central Pulse Pressure (cPP) in mmHg. Model 1: adjusted for age, sex, mean arterial pressure and heart rate; Model 2: additionally adjusted for Cumulative Illness Rating Scale total score. Dots represent mean values, bars represent 95% confidence intervals.