Figures & data

Table 1 Two-Sample Mendelian Randomization Instrument Characteristics
Figure 1 Two-sample Mendelian randomization testing the causal effect of circulating levels of glutamine (Gln) on Alzheimer’s disease (AZD). Estimates of the SNP-Gln association () are calculated in sample 1 (Kettunen et al (2016) GWASCitation9). The association between these same SNPs and AZD (
) is then estimated in sample 2 (IGAP GWAS). These estimates are combined (
=
). The
Wald ratio estimates for each of the four SNPs are meta-analyzed using the inverse-variance weighted (
IVW) method and sensitivity analyses. The IVW method produces an overall causal estimate of circulating glutamine on AZD.
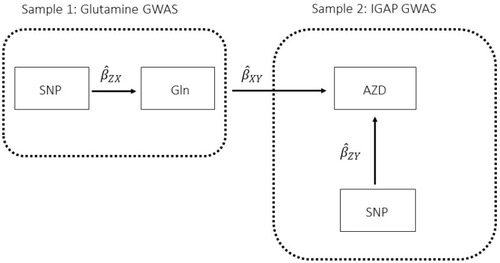
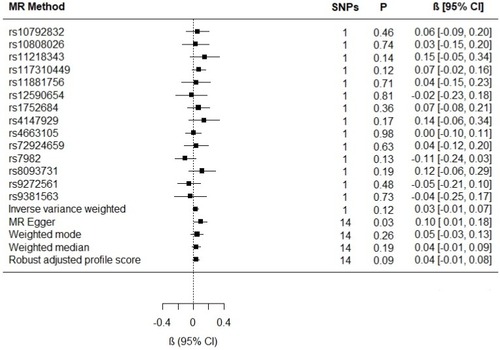
Figure 2 Individual SNP and multi-instrument MR results for the effect of circulating glutamine on Alzheimer’s disease. In addition to the test of the causal effect of glutamine on Alzheimer’s disease (depicted above), the MR-Egger method provides a test of whether its intercept is different from zero. MR Egger intercept = 0.01; 95% CI −0.03, 0.04; P value=0.60 (four-SNP instrument).
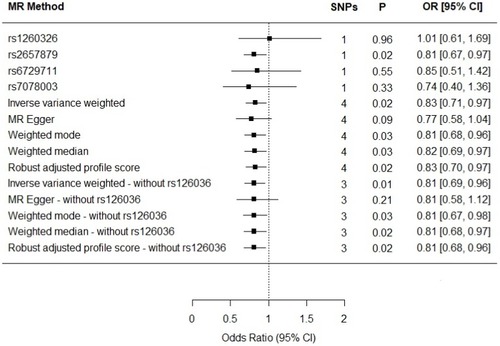
Figure 3 Individual SNP and multi-instrument MR results for the effect of Alzheimer’s disease on circulating glutamine. MR Egger intercept (−0.01; 95% CI −0.03, 0.002; P value = 0.09).