Figures & data
Table 1 The Portion and Distribution of Clinical Features of Elderly Patients with Metastatic Renal Cell Carcinoma Before and After Propensity Matching
Figure 1 Kaplan–Meier curves of overall survival for elderly metastatic renal cell carcinoma according to cytoreductive nephrectomy (A), partial nephrectomy and radical nephrectomy (B, C).
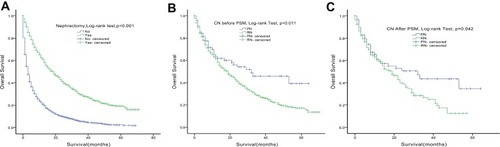
Table 2 Survival Comparison of PN and RN Among Different Subgroups of Elderly Metastatic Renal Cell Carcinoma
Figure 2 Survival comparison of patients undergoing cytoreductive nephrectomy according to tumor size ≤7cm (A), isolated metastasis (B) and N0 stage (C) and N1 stage (D).
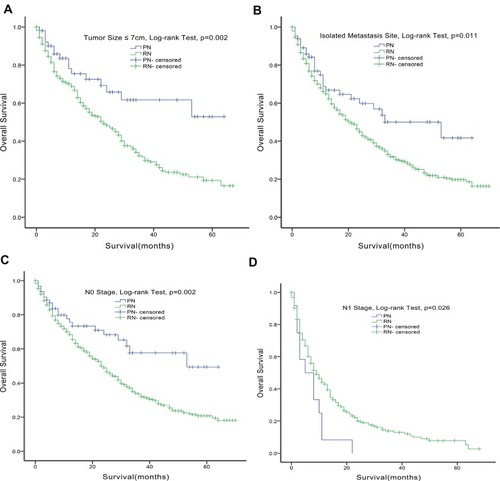
Table 3 Multivariate Cox Regression Analyses of Prognostic Factors Influencing the Overall Survival of Elderly Patients with Metastatic Renal Cell Carcinoma Who Were Treated with Partial Nephrectomy. (Step 2, Follow LR)
Figure 3 Risk analysis of patients undergoing cytoreductive partial nephrectomy according to tumor diameter >7cm (A) and N1 stage (B).
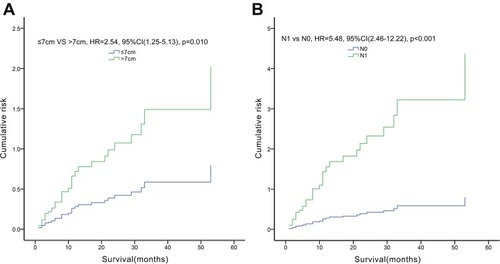
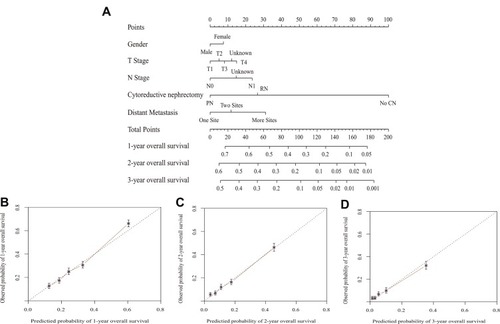
Figure 4 Nomogram model (A) for elderly metastatic renal cell carcinoma and calibration curve of survival probability prediction: 1-year (B), 2-year (C), 3-year (D).