
Figures & data
Table 1 SARC-F Score
Table 2 Patient Characteristics
Figure 1 Classification of the study participants.
Abbreviation: EWGSOP 2, European Working Group on Sarcopenia in Older People 2.
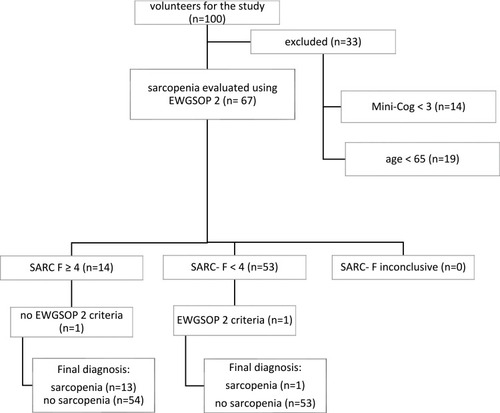
Table 3 Internal Coherence of the Polish Version of the SARC-F Questionnaire
Table 4 Contingency Table Showing Sample Distribution, According to the Polish Version of the SARC-F Questionnaire and the EWGSOP2 Criteria (N= 67)
Table 5 Criterion Validity Between the Polish Version of the SARC-F Questionnaire and the EWGSOP 2 Criteria
Figure 2 The ROC curve of SARC-F against the EWGSOP 2 criteria.
Abbreviation: EWGSOP 2, European Working Group on Sarcopenia in Older People 2.
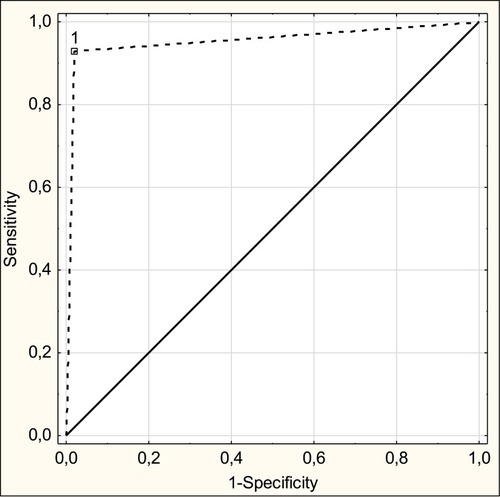
Table 6 Validation Between the SARC-F (Each Domain and Total Score) and Other Related Measurements