Figures & data
Table 1 English Version of the Frail’BESTest: Instructions and Evaluation
Figure 1 English version of the Frail’BESTest.
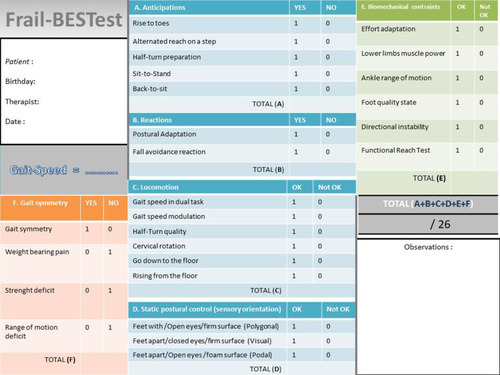
Table 2 Comparisons Between BESTest and Frail’BESTest Items
Figure 2 Patient distribution in center 1 and center 2.
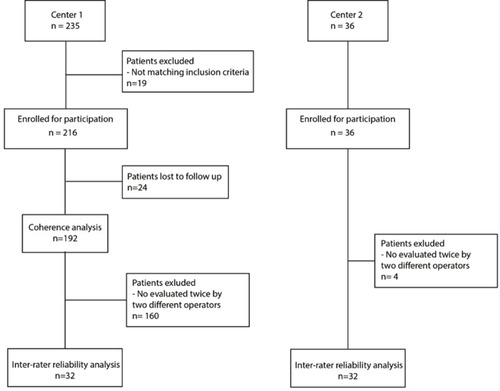
Table 3 Characteristics of the 192 Non-Frail and Frail Patients Enrolled in Center 1
Figure 3 Distribution of the scores obtained by the 192 patients for each test and descriptive data regarding distribution for the three tests (frail patients in the upper portion and non-frail patients in the lower portion). The black curve represents the theoretical normal curve extracted from the observed distribution. The table indicates means, standard deviations, medians and quartiles of each distribution regarding regarding frailty status. Skew and Kurt report the skewness and kurtosis of each distribution. *indicates significant parameters.
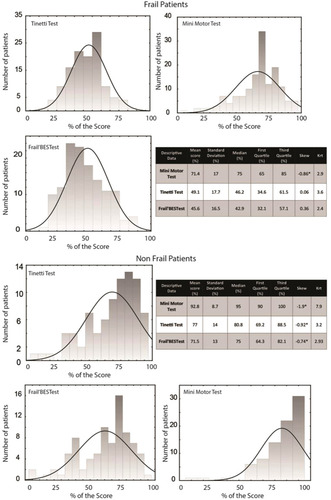
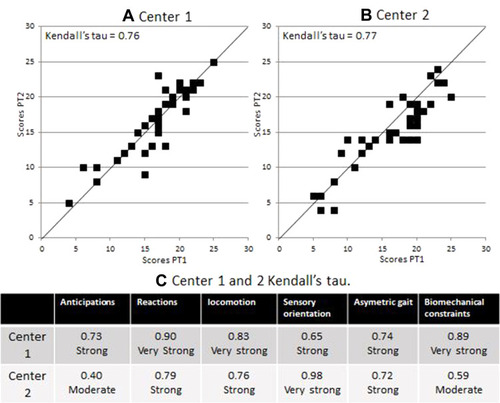
Figure 4 Presentation of the interrater reliability of the total Frail-BESTest Score in center 1 (A) and center 2 (B). Kendall’s tau coefficients for each system and each center (C).