
Figures & data
Table 1 Baseline Characteristics of Study Participants
Figure 1 Participant flow chart.
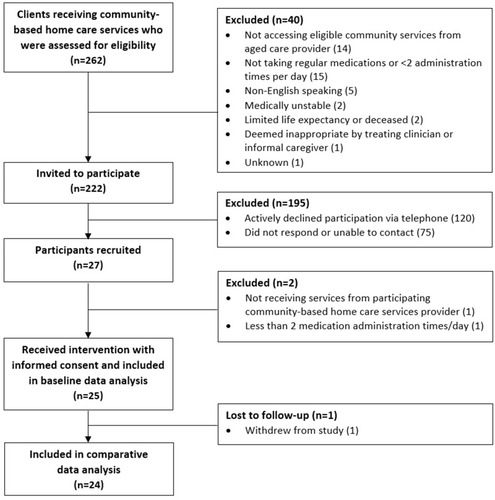
Table 2 Time Spent by the Clinical Pharmacist on Intervention Delivery and Follow-Up
Table 3 Nature and Number of Discrepancies Observed with the Medication List Collected at Baseline from the Participant’s General Medical Practitioner Compared to the Best Possible Medication History (n=24 Participants)a
Table 4 Clinical Significance of Medication Discrepancies Assessed Independently by Two Pharmacists
Table 5 Comparison of Secondary Outcome Measures at Baseline and Four Months (n=24 Participants Unless Otherwise Stated)