
Figures & data
Table 1 Swimming Exercise Training Protocol
Figure 1 Sections of liver tissue from different groups. (A) Control, (B) saline, (C) garlic, (D) exercised, and (E) exercise + garlic groups: (1) central vein, (2) hepatocells; (3)and (7) mild parenchymal inflammation; (4) and (5) sinusoidal dilatation.
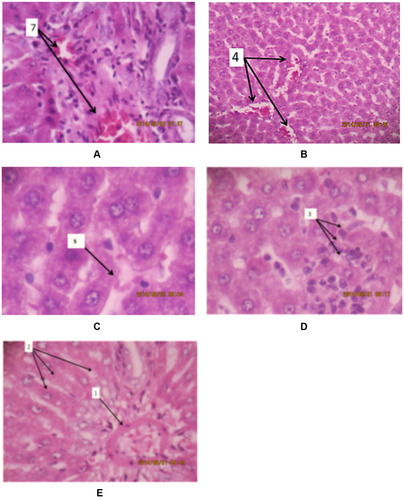
Figure 2 Sections of renal tissue from different groups: (A) control, (B) saline, (C) exercise, (D) garlic, and (E) exercise + garlic groups. Black arrows: mild necrosis, intratubular hemorrhage and sloughing of epithelium.
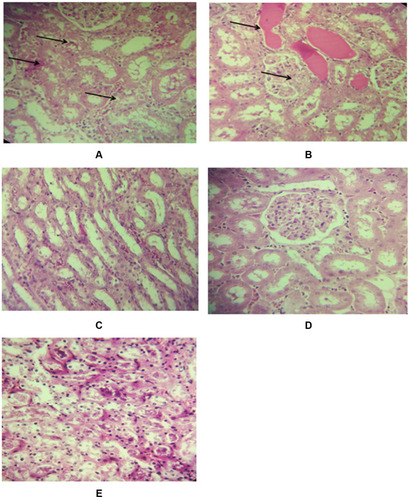
Table 2 The Mean±SD of the Hepatic and Renal Apoptosis Biomarkers in Different Groups
Table 3 The Mean±SD of Urea, Uric Acid and Creatinine Levels in Different Groups
Table 4 The Mean±SD of Liver Enzyme Activity in Different Groups
Table 5 The Mean±SD of Liver and Renal Antioxidant Activity in Different Groups