
Figures & data
Table 1 Basic Characteristics of Patients in the Four Groups (n = 30 for Each Group)
Figure 1 Consort diagram for the study.
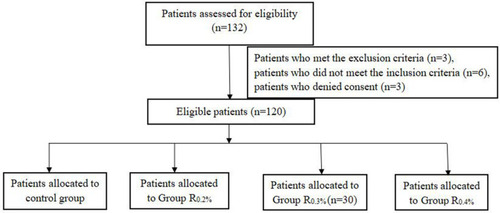
Table 2 Analgesic Use After Surgery and Recovery Time in the Four Groups (n =30 in Each Group)
Figure 2 NRS score at different times after surgery in the four groups. (A) NRS score when patients were at rest. (B) NRS score when patients were active. *P<0.05 compared with R0.2%, R0.3% and R0.4% groups, #P<0.05 compared with R0.3% and R0.4% groups.
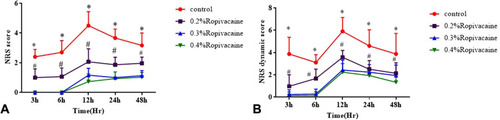
Figure 3 (A) Total number of complaints during 3, 6, 12, 24 and 48 h. (B) Time that pain was first felt after surgery. (C) Total tramadol consumption (mg) in 24 h. (D) Satisfaction score in the ropivacaine groups 48 h after surgery. *P<0.05 compared with R0.2%, R0.3% and R0.4% groups, #P<0.05 compared with R0.3% and R0.4% groups.
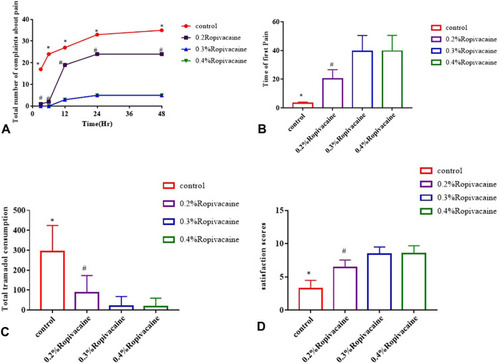
Table 3 Prevalence of Adverse Events in the Four Groups (n = 30 in Each Group)