Figures & data
Figure 1 Flow diagram of the enrolment, intervention allocation, follow-up, and data analysis.
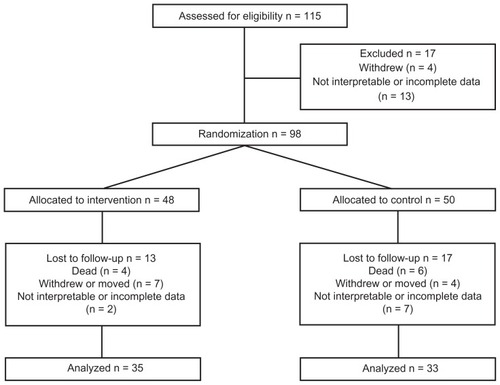
Table 1 Functional status related to toilet habits and according to group among the 68 included nursing home patients
Table 2 Daily amount of leakage (grams) at baseline and 3-month post-intervention adjusted for baseline level, age, sex, and functional status
Table 3 Multiple linear regression analysis with change in leakage as dependent variable (intervention group only)