Figures & data
Table 1 Cohort Clinical Characteristics Organized by Incidence of Composite Endpoint (Fall, Hospitalization Institutionalization or Death) Within One Year
Table 2 Cohort Functional Characteristics Organized by Incidence of the Composite Endpoint (Fall, Hospitalization, Institutionalization or Death) Within One Year
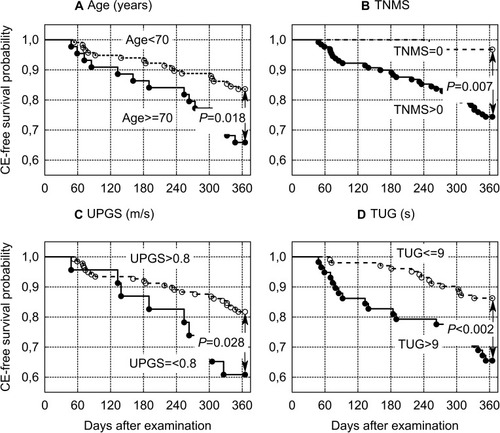
Figure 1 Probability of composite endpoint (CE)-free survival in subjects classified according to: (A) age, (B) total number of medications and supplements (TNMS), (C) usual pace gait speed (UPGS), and (D) Timed Up and Go (TUG) test. The CE included the following adverse events: fall, hospitalization, institutionalization and death.