
Figures & data
Figure 1 Flowchart showing the steps in identification, allocation, and the classification of participants in to each of the categories: obese only (O), osteopenic obese (OO), sarcopenic obese (SO), and osteosarcopenic obese (OSO) in a population of obese older people.
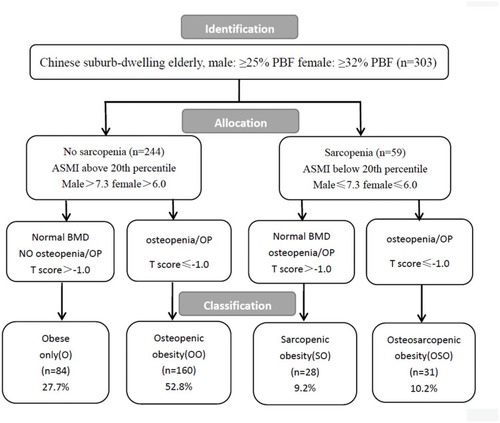
Table 1 Body Composition Variables and Physical Performance of Study Population by Gender
Table 2 Lifestyle Factors and Diseases of Study Population by Gender
Table 3 Adjusted Relationships of Grip Strength, WS, and TUGT Among OO, so, OB and OSO Groupsa